


A typical spectral image lambda stack gathered by the microscope is often composed many thousands or even millions of individual spectra (depending upon the lateral image dimensions), with essentially one spectrum being represented at each pixel location. The associated data files are therefore quite large and complex (virtually impossible to analyze by visual inspection), thus requiring a dedicated software palette for interpretation and presentation of the results. Analysis of lambda stacks can target the extraction of spectral data or image features (or both) using tools that are either packaged with the instrument or widely available from aftermarket manufacturers. Each fluorophore or absorbing dye, regardless of the degree of spectral overlap with other probes, has a unique spectral signature or emission fingerprint that can be determined independently and used to assign the proper contribution from that probe to individual pixels in a lambda stack. The result of the linear unmixing technique is the generation of distinct emission fingerprints for each fluorophore used in the specimen (or excitation fingerprints if excitation rather than emission spectra were employed to generate the lambda stack).
The tutorial initializes with a lambda stack of three nuclei expressing ECFP, EGFP, and EYFP appearing in the window. The spectral profiles of the fluorophores in the successive lambda planes are presented in the spectral graph and each individual plane can be viewed in the image window. The Lambda Stack Depth slider can be used to transition between lambda planes. In order to select a different specimen, use the Choose Spectral Profile pull-down menu.
Spectral imaging merges the two well-established technologies of spectroscopy and imaging to produce a tool that has proven useful in a variety of disciplines that rely on various forms of optical microscopy. The methodology has been extensively applied to visualize the chemical composition of materials ranging from enzymes involved in biomolecular interactions to the formation of stars. Unlike a typical image, which is acquired over the entire wavelength response band of the detector, a spectral image requires the creation of a three-dimensional data set that contains a collection of images of the same viewfield captured at different wavelengths or wavebands. In effect, the spectral image provides a complete spectrum of the specimen at every pixel location (noted as I(x,y,λ); see Figure 1) throughout the lateral dimensions. Thus, a spectral image stack can be considered as either a collection of images, each of which is measured at a specific wavelength or over a narrow band of wavelengths, or as a collection of different wavelengths at each pixel location.
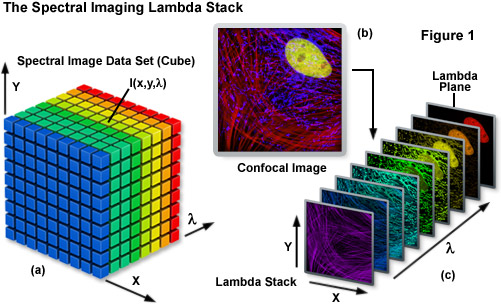
The spectral image stack (I(x,y,λ)) discussed above is commonly referred to in the scientific literature as a lambda stack, image cube, or spectral cube having wavelength bands generally ranging from 2 to 10 nanometers and image dimensions up to a million pixels (see Figure 1), depending upon the instrument configuration. For all practical purposes in fluorescence microscopy, a lambda stack can be considered analogous to a time-lapse series or optical section z-stack gathered by a widefield deconvolution or confocal microscope. For a qualitative assessment of the lambda stack, a region of interest in the x-y dimension (lateral focal plane) can be examined along the wavelength axis to determine how pixel intensity and/or color changes due to signal level variations at different emission bands (λ planes; Figure 1(c)). In other words, the emission spectrum of a particular fluorophore can be determined by plotting the pixel intensity versus the center wavelength of each emission band. The accuracy of the emission spectra obtained by this technique depends largely on the number of images gathered at distinct wavelength bandwidths, the bandwidth size (shorter bandwidths yield more accurate spectra), specimen quality, and the instrument detector sensitivity. In confocal microscopes that use separate pinholes for each detector, wavelength-dependent variations can occur in optical section thickness for the different spectral channels. However, most modern instruments are designed with a single pinhole for all detectors and, in any event, probes with highly overlapping spectra are usually in a very similar in spectral range.
Contributing Authors
Tony B. Gines and Michael W. Davidson - National High Magnetic Field Laboratory, 1800 East Paul Dirac Dr., The Florida State University, Tallahassee, Florida, 32310.