When experimental conditions permit, the thoughtful selection of fluorescent labels, laser multitracking strategies, filter set characteristics, and control specimen correction factors can combine to yield excellent results. In the real world, however, situations often arise where the choice of experimental parameters is limited and the use of fluorescent probes lacking in significant spectral overlap is not feasible. Such a scenario is often encountered when attempting to conduct multiple labeling investigations with fluorescent proteins. Experiments are also subject to artifacts arising from natural autofluorescence or fluorescence induced by the use of fixatives or DNA transfection reagents, which can span several detection channels. In these cases, a technique known as spectral imaging coupled with image analysis using linear unmixing can be employed to segregate mixed fluorescent signals and more clearly resolve the spatial contribution of each fluorophore (often referred to as emission fingerprinting). This interactive tutorial explores how multiple fluorophores can be distinguished using spectral imaging techniques.
The tutorial initializes with the image of a stained embryonic rat fibroblast cell appearing in the image window and the summed spectrum from a spectral scan of the specimen appearing in the spectral window. In order to operate the tutorial, click on the bull's-eye icon in the image window and drag it across the specimen to view variations in the composition of the stains used to highlight organelles. The fluorescent probes are EGFP (red curve), Alexa Fluor 488 (green curve), and Alexa Fluor 514 (blue curve), which add together to generate the summed spectrum (black curve). The percentage of each fluorophore in the pixel chosen by the bull's-eye icon is listed next to fluorophore legend in the lower portion of the tutorial window. Use the pull-down menu to select a new specimen and new fluorophores. To automatically relocate the bull's-eye icon to a specimen region containing only a single fluorophore, click on the Auto button next to the fluorophore names.
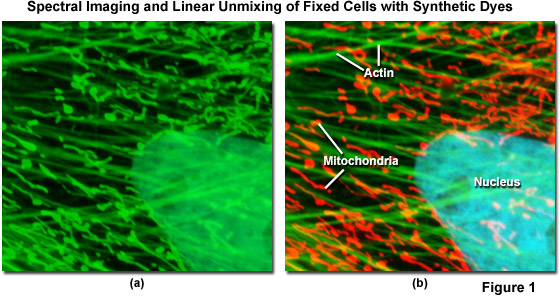
Spectral imaging combined with linear unmixing is a highly useful technique (see Figure 1) that can be used in combination with other advanced imaging modalities to untangle fluorescence spectral overlap artifacts in cells and tissues labeled with synthetic fluorophores that would be otherwise difficult to separate. Illustrated in Figure 1 is an Indian Muntjac fibroblast cell stained with a combination of SYTOX Green (nucleus), Alexa Fluor 488 conjugated to phalloidin (filamentous actin network), and Oregon Green 514 conjugated to goat anti-mouse primary antibodies (targeting mitochondria). These dyes have emission maxima at 523, 518, and 528 nanometers, respectively, and each appears green to the eye when viewed in widefield fluorescence using a standard FITC cube (Figure 1(a); imaged in confocal mode with a 488-nanometer argon-ion laser). Using laser scanning confocal microscopy coupled with a spectral imaging detector, the entire spectrum of fluorophores in the specimen was first gathered (Figure 1(a)), and then linearly unmixed and assigned pseudocolors (Figure 1(b); nucleus, cyan; actin, green; mitochondria, red) to more clearly delineate the relative proximity of the various structures.

A typical spectral image lambda stack gathered by the microscope is often composed many thousands or even millions of individual spectra (depending upon the lateral image dimensions), with essentially one spectrum being represented at each pixel location. The associated data files are therefore quite large and complex (virtually impossible to analyze by visual inspection), thus requiring a dedicated software palette for interpretation and presentation of the results. Analysis of lambda stacks can target the extraction of spectral data or image features (or both) using tools that are either packaged with the instrument or widely available from aftermarket manufacturers. Each fluorophore or absorbing dye, regardless of the degree of spectral overlap with other probes, has a unique spectral signature or emission fingerprint that can be determined independently and used to assign the proper contribution from that probe to individual pixels in a lambda stack. The result of the linear unmixing technique is the generation of distinct emission fingerprints for each fluorophore used in the specimen (or excitation fingerprints if excitation rather than emission spectra were employed to generate the lambda stack). In summary, the spectral information in an image captured by the microscope is binned into three broad spectral ranges roughly corresponding to the primary additive colors red, green, and blue. Linear unmixing enables the precise determination of spectral profiles at every pixel in the image to overcome overlap and binning artifacts, and therefore is able to reassign color to regions that would otherwise appear mixed. The algorithms can be readily applied to virtually any lambda stack generated using additive fluorescent probes, but images containing absorbing dye signatures (imaged in brightfield) and reflectance images must be converted to optical density before applying linear unmixing algorithms.
Contributing Authors
Adam M. Rainey and Michael W. Davidson - National High Magnetic Field Laboratory, 1800 East Paul Dirac Dr., The Florida State University, Tallahassee, Florida, 32310.


