


In the non-linear structured illumination techniques named saturated pattern excitation microscopy (SPEM) and saturated structured illumination microscopy (SSIM), the ground state (S0) is depleted by saturated excitation (to the S1 state) through an inverse RESOLFT scheme that enables the fluorescence generated by this transition to be recorded on an area-array detector. These techniques are performed using a grid-like array of line-shaped intensity maxima and minima rather than the typical doughnut-shaped phase modulation that is utilized by STED and GSD. The saturated excitation produces narrow line-shaped dark regions in the zero nodes that are surrounded by high levels of fluorescence signal to generate a "negative" imprint of the features being imaged. Thus, in SPEM and SSIM, it is the off state of a fluorescent probe (rather than the on state) that is confined by the phase modulation zero node. The grid lines are rotated several times to generate data for a single image, which is retrieved mathematically during post-acquisition processing.
The tutorial initializes with a depletion and excitation beam appearing superimposed over a virtual specimen in the upper portion of the tutorial window. The specimen contains dark rectangles representing individual fluorophore molecules highlighted by a white curve that represents the analog fluorescence signal. In order to operate the tutorial, use the mouse cursor to move the Scan Progress slider back and forth. As the cyan excitation beam traverses across the specimen, the black fluorophore boxes that overlap the excitation region become fluorescent (turn green), whereas those between the STED beams remain dark. Simultaneously, the fluorophore(s) are noted at the CCD Image Plane and are recorded in the Image at the lower portion of the tutorial window when the Scan Progress slider reaches the far right boundary. The tutorial can be run automatically using the Autoscan button or re-initialized with the Reset button.
In SSIM and SPEM, structured illumination is produced by two powerful interfering light beams from a single laser that form a standing wave grid pattern projected across the lateral dimensions of the specimen. Only the first diffraction orders (+1 and -1) are used to create the interference pattern and the zeroth order from the laser source is blocked with a beam stop. Most of the exposed fluorescent probes within the specimen saturate due to exposure to the intense illumination, leaving only narrow dark line-shaped volumes (zero nodes) having a period of approximately 200 nanometers at the edges of the interference pattern. As the excitation energy is increased, the walls surrounding the nodes become much larger, thus reducing the size of the point-spread function. The methodology is implemented on widefield, non-scanning microscopes by phase-shifting the pattern to render otherwise unresolvable superresolution information visible in the form of harmonic frequencies and fundamental moiré fringes. Due to the fact that resolution is only improved in the direction perpendicular to the line-shaped zero nodes, the pattern must be shifted in several directions to cover a large number of angles in the focal plane.
Non-linear structured illumination techniques are similar to STED microscopy in that the time to conduct measurements is theoretically independent of labeling density, and photostability of the fluorescent probes dictates performance. The mechanism by which resolution is increased in SSIM and SPEM is described in terms of Fourier components and spatial frequencies. However, similar to the other point-spread function engineering techniques of STED and GSD described above, non-linear structured illumination microscopy takes advantage of steady-state saturation where high resolution information is obtained only after the system has reached fluorophore-saturating conditions. Additionally, spatial resolution scales with the level of saturation to generate images having a lateral resolution in the vicinity of 50 nanometers under optimal conditions of signal-to-noise and low photobleaching. Because of the time necessary to rotate the projected grid pattern, the specimen must be motionless for relatively long periods of time, but the fluorophores suitable for SSIM and SPEM do not require specialized photoswitching properties.
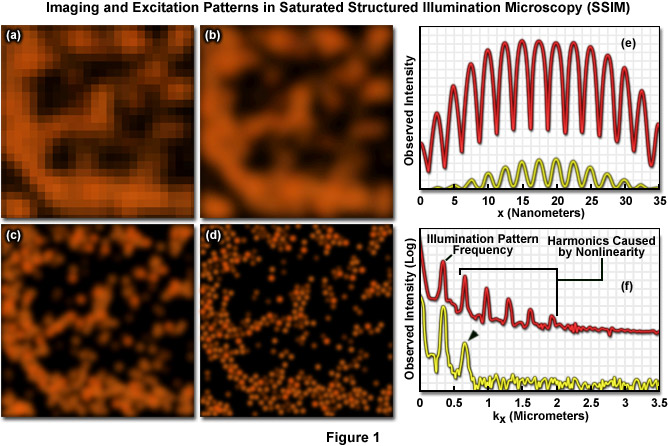
Presented in Figure 1 are high resolution images of 50-nanometer fluorescent beads along with intensity profiles generated by a uniform layer of fluorescent dye illuminated by a line pattern-modulated Gaussian beam in saturated structured illumination microscopy. In widefield microscopy the fluorescent beads exhibit poor resolution (Figure 1(a)) and appear as a blurred mass. Mathematical filtering of the widefield image (Figure 1(b)) produces scant improvement, but linear structured illumination (Figure 1(c)) yields higher resolution. The most dramatic increase in lateral resolution is achieved with SSIM (Figure 1(d)) using three harmonic orders (Figures 5(e) and (f)) during image processing. Intensity profiles through images of the thin layer of fluorescent dye with a modulation period of 2.5 micrometers are shown in Figure 1(e) at high (red curve) and low (yellow curve) peak energy densities. The lower curve closely follows the sinusoidal illumination pattern because the peak energy density lies beneath the saturation limit. In the top curve, the higher pulse energy induces fluorescence to saturate near the peaks. The Fourier transforms (Figure 1(f)) corresponding to the illumination patterns in Figure 1(e) exhibit several harmonics produced by the non-linearity of the saturating illumination intensity (red curve), whereas only the lowest harmonic is detectable in the lower energy pattern (yellow curve).
Contributing Authors
Stephen P. Price and Michael W. Davidson - National High Magnetic Field Laboratory, 1800 East Paul Dirac Dr., The Florida State University, Tallahassee, Florida, 32310.