Introduction
Among the most important aspects to consider in live-cell imaging is that illumination of the fragile specimen must be reduced to a level that is not detrimental to the health and viability of the culture. Unlike the situation in fixed and mounted specimens, a massive photon flux (at radiation intensities commonly applied for fluorescence and brightfield imaging) can seriously affect the biology of living cells. In essence, millions of years of evolution have yet to develop an effective protection against a light intensity that ranges between 100 and 10,000 times greater than normal terrestrial levels.
Mammalian cells are generally transparent and lacking intracellular components that absorb significant levels of visible light; however, plant cells (a growing arena for live-cell imaging) contain an extraordinary number of molecules that absorb, redirect, or serve to interpret incident light. Activating or damaging these biomolecules can affect physiological processes as well as initiate stress responses, producing direct feedback on the biology under study. Beyond the intrinsic biological issues, excessive exposure to light can photobleach the synthetic dyes and fluorescent proteins commonly used for contrast generation in live-cell imaging. Photobleaching destroys the signal and introduces toxic free radicals into the cell. Thus, the level of illumination utilized to create a digital image must be balanced against specimen damage and signal loss over the duration of the investigation. Accomplishing that goal requires a thorough understanding of basic digital imaging and how the elements of various microscope systems contribute to image formation.
The Ideal Digital Image
An image is defined as an overall distribution of intensities whereas an individual feature is a subset of image intensities that forms a pattern. A feature may be simple, such as a point or line, or very complex, such as a collection of points that constitute a recognizable object (for example, a nucleus). Confidence in a particular feature's identity is based upon how well the pattern in the image matches a specific set of criteria set for an object pattern, combined with the uniqueness of the pattern within the image. Finding a bright point, for instance, requires detecting an intensity difference with the background. However, locating a specific bright point in a field of points requires more information about relative intensity or position. Finally, identifying a feature with the complexity of a nucleus entails detecting subtle intensity changes grouped in a spatially related context. The important point is that features of varying complexity require different amounts of information for identification. The goal in imaging a fixed specimen is to maximize the information content in the image. In contrast, a suitable live-cell image contains just enough information to confidently identify the feature of interest. Collecting more information can (and often will) unnecessarily damage the cells or the probes used to identify the feature.
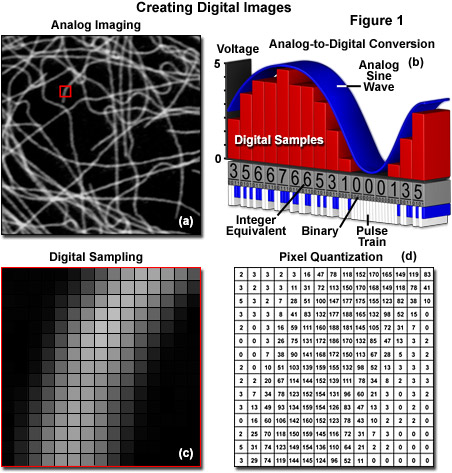
The analog representation of an intracellular microtubule network highlighted with a fluorescent protein fused to tubulin monomers and imaged with a spinning disk confocal fluorescence microscope is presented in Figure 1(a). After sampling in a two-dimensional array through an analog-to-digital converter by the camera circuitry (Figure 1(b)), brightness levels at specific locations in the analog image are recorded and subsequently converted into integers during the process of quantization (Figures 1(c) and 1(d)). The goal of this effort is to convert the image into an array of discrete points that each contain specific information about brightness or tonal range that is described by a specific digital data value in a precise location. The sampling process measures the intensity at successive locations in the image and forms a two-dimensional array containing small rectangular blocks of intensity information. After sampling is completed, the resulting data is quantized to assign a specific digital brightness value to each sampled data point, ranging from black, through all of the intermediate shades of gray, to white. The result is a numerical representation of the intensity, which is commonly referred to as a picture element or pixel, for each sampled data point in the array.
The optical microscopy imaging system uses light to convert a molecular distribution (the specimen) into a representative distribution of intensities (the image). In that sense, neglecting optical artifacts, any measurable difference in image intensity is related to information about the specimen. When a specimen is probed with light, the physics of light gathered by lenses and the damaging effects of irradiation fundamentally limit the quantity of light available for image formation and the spatial dimensions over which intensity differences can be discriminated. In other words, the optical system imposes an upper boundary on the amount of information that can be collected from the specimen (see Figure 2(a)). The image detector (in effect, a digital camera) further limits gathering of information based on the amount of space and intensity that are grouped together to create each pixel value (see Figure 2(b)). As an example, a 100 x 100 pixel array obviously contains limited information capacity. Increasing the total number of pixels by two orders of magnitude, creating a 1000 x 1000 array while maintaining the same physical size, provides significantly more spatial information, but at the cost of sensitivity. Each array element (pixel) now collects only one-hundredth as much light. Generating the optimum representation of the specimen, while not producing damage in the process, therefore requires knowledge of the microscope optical limits and the compromises that must be made with digital camera systems.
Confidence in determining the identity of a feature relies on the principles surrounding the measurement. As an abstract example, consider 100 separate determinations of the length of a single ball-point pen using a number of graded plastic rulers. The pooled measurement values form a distribution, where the mean value represents the best approximation of pen length and the spread indicates the confidence level in that averaged value. A distribution having 50 tightly grouped values is far more accurate than an average from five measurements that are broadly spaced. The data spread, which represents the precision of the measurements, is important due to the fact that a broad, highly asymmetric or multi-modal distribution lowers the confidence level and suggests a measurement error. The accuracy of the distribution estimate (how close it is to the true length value) depends on the number of measurements along with errors, such as minute differences in the plastic rulers and the investigator's precision in analyzing the data.
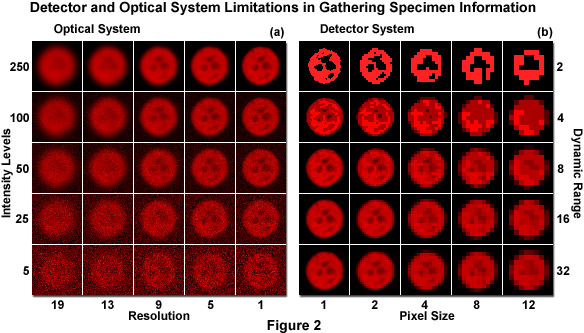
The limitations of the microscope optical system and digital camera in collecting specimen information are illustrated in Figure 2. The specimen is a nucleus of a human cervical carcinoma cell (HeLa line) expressing the histone H2B fused to mCherry fluorescent protein. Images were captured in grayscale and pseudocolored red. The optical system determines the quantity of light available for contrast generation and the physical resolution limit (Figure 2(a)). As light intensity increases (bottom to top), the photon counting noise becomes less apparent. Similarly, as optical system resolution increases (left to right), the general features of the nucleus appear more distinct. Note how intensity and resolution work together. In Figure 2(b), the detector system (camera) takes the information captured in the microscope and samples the data into discrete light levels (bottom to top) and spatial elements (left to right). As pixel size increases (Figure 2(b), left to right), feature details are lost until the identity of the image is lost. Similarly, as the number of intensity levels (dynamic range) decreases (Figure 2(b)), bottom to top), shading is lost and only highly contrasted features remain. Note that the two factors work together in providing information. In live-cell imaging, the amount of information collected should be proportional to the amount required for verifying a hypothesis.
Every image gathered during an experiment constitutes an individual measurement, where the information in the image contributes to the confidence level of the final result. Images of living cells are often grainy, soft, and poorly composed, but may still represent the maximum amount of information that can be extracted from the specimen under the prevailing experimental conditions. Synonymous with the pen length example described above, confidence in claims of feature identity in live-cell imaging rely on capturing many examples of the feature, evaluating the range of variance, and demonstrating that the feature does not differ from a positive control. In summary, even if an image is lacking in aesthetic appeal, it represents a suitable candidate if it contains the information necessary to detect a feature and further the test of a hypothesis.
As previously emphasized, live-cell imaging involves a significant compromise between image quality and specimen viability. Ensuring a good compromise requires a practical understanding of image quality. To start, the relationship between the representative units employed for describing image quality (pixels and gray levels) to the physical units of the specimen measurement (nanometers and photon flux) must be established. Ideally, every pixel value in the image would represent the exact photon count arising from a precisely defined area of the specimen, independent from all of the neighboring pixels. Unfortunately, that is never the case. Gray level values and the degree to which picture elements (pixels) define the morphology of an object are relative estimates. This important relationship is commonly explained using the concepts of contrast and resolution.
Light Intensity
The act of opening a camera shutter enables light energy to be focused on the image sensor array (usually a charge-coupled device, CCD) and to be collected within the pixel elements. Over time, the accumulated conversion of photons to electrons (photoelectrons) reveals a Poisson distribution of events. In other words, photon emission has the fundamental property of being stochastic (random) with respect to time. In addition to the photoelectrons (constituting the signal) gathered in the array elements, spurious electrons also accumulate randomly (noise). The stochastic nature of both these events has a defining influence on the ability to place an exact value on light intensity (see Figure 3(a)). If an image is captured with no light impinging on the sensor, the signal-independent electrons (termed dark noise) collect and form a distribution, which is characterized by a mean value and a standard deviation. The mean represents a background while the standard deviation describes the uncertainty, or system noise, inherent in the signal value. When a pixel gathers light, photoelectrons from both the specimen and random noise generated in the sensor are collected simultaneously, but these cannot be distinguished from each other. The background value, calculated from a dark image, is often subtracted from each pixel value in the image, but the uncertainty due to the noise (estimated as the standard deviation of the averaged background) is not simply subtracted away. Each pixel contains signal and noise electrons that are converted into an integer value representing an intensity or gray level.
It should be clear that each pixel value represents only a statistical estimate of the photon flux associated with a specific region in the specimen. Because relative intensity levels comprise the entire data set in an image, any estimates of intensity are associated with varying degrees of confidence (depending on the signal-to-noise ratio, described below). As each pixel value constitutes the single measurement of a Poisson process, the odds of that single value representing the long-term average of photon flux are roughly approximated by a normal (Gaussian) distribution, with the first standard deviation equal to the square root of the pixel value. Note that the square root relationship is critical because it defines the maximum confidence of a single measurement of photon flux, even when all of the electronic noise is eliminated.
The overriding factor in digital microscopy of living cells is that only an estimate can be made of the quantity of light originating within a particular region of the specimen, and the confidence in that estimate depends upon the magnitude of the signal and the noise in the measurement system. In other words, everything in live-cell imaging ultimately boils down to a signal-to-noise issue. Thus, the most common nomenclature for specifying the data quality obtained from a detector is known as the signal-to-noise ratio, and a ratio of 2.7:1 has been suggested as the lower limit for the ability to detect signal over noise. As a simple example, consider two consecutive exposures, one with the camera shutter closed and the other with the shutter open. In this hypothetical case, the dark image has an average pixel value of 50 and a standard deviation of 7. Likewise, the specimen image has a pixel value of 114, which is significantly above the background. The signal equals the specimen value minus the background (114 - 50 = 64). The total noise from the system has a value of 7 (this can also be estimated as the square root of the dark image value, 50) that is added in quadrature to the photon counting noise, which is equal to the square root of 64. Simply dividing the signal (64) by the noise (square root of the sum: 50 + 64) yields a signal-to-noise ratio of about 6. When the specimen pixel values fall below an average of 73, where the signal-to-noise ratio approaches 2.7, the odds that this value is related to statistical fluctuation, rather than signal, grow uncomfortably high. As a general rule of thumb, each unit of signal-to-noise equals roughly one standard deviation from the mean signal value. Therefore, 2.7 standard deviations implies a reasonable confidence for detecting signal in most application. However, it should be borne in mind that signal-to-noise requirements depend upon the type of analysis used to quantify images. Unsupervised analysis based on thresholding, for example, will require a higher level of signal-to-noise that merely using visual observation to count events.
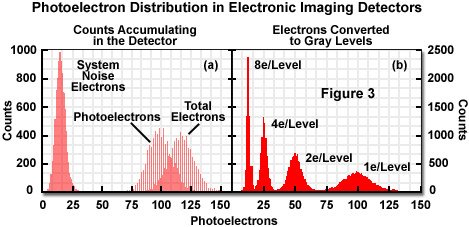
Intensity values are, in most cases, created from multiple photoelectrons, as illustrated in Figure 3(a). This implies that the distribution of pixel values no longer forms a Poisson distribution where the standard deviation (noise estimate) equals the square root of the mean. Therefore, measuring the standard deviation is a far superior approach to approximating the noise level. For live-cell imaging, some light is collected that is unrelated to the feature of interest (arising, for example, from autofluorescence). As additional unwanted light is added to the image from artifacts such as autofluorescence, internal reflections, or signal removed from the plane of focus, the feature of interest becomes increasingly difficult to identify.
Presented in Figure 3 is an illustration depicting how signal and noise electrons appear randomly with respect to time. In Figure 3(a), the simulated distribution of counts collected in a single detector element over 10,000 exposures is displayed. The signal-independent (noise) electrons, representing dark current and readout noise, form a distribution of system noise with an average of 16 and a standard deviation of 4. The distribution of photoelectrons from the specimen has an average of 100 and a standard deviation of 10. The detector records the combined signal and noise photoelectrons to yield an average value of 110 and a standard deviation between 10 and 11. Figure 3(b) demonstrates conversion of the signals to a gray level using 1, 2, 4, or 8 electrons per gray level. Increasing the number of electrons per gray level lowers sensitivity but increases confidence in the intensity value.
In practice, light from extraneous sources and electronic noise are estimated together by calculating the average value and standard deviation from an area near the specimen instead of a dark frame captured with no light being admitted to the camera. The background can change from image to image and should be taken from enough pixels (more than 36) to create a robust estimate for the mean and standard deviation. The signal is generally calculated as the average of a few closely associated pixels minus the previously calculated background value. The noise value approximation, as described above, is created by adding the noise components in quadrature, using the square root of the signal value for the noise estimate when necessary. The final signal-to-noise ratio now takes into consideration the effect of unwanted stray light. In cases where stray light values are extremely high (approaching or exceeding that of the signal), the signal can no longer be detected because the noise has increased the level of uncertainty for the pixel intensity.
The confidence of an intensity estimate can be increased through data pooling or averaging. It is obvious that utilizing the averaged value from 50 pixels to represent an intensity is a much stronger argument than claiming that the intensity from a single pixel accurately represents the real specimen intensity. Summing or averaging a block of pixels together, a technique commonly referred to as binning, increases the confidence (intensity) at the expense of spatial resolution. Likewise, averaging sequential frames together increases confidence at the expense of temporal resolution. The signal-to-noise increase obtained by spatial or temporal averaging is generally proportional to the square root of the number of pixels averaged. Therefore, provided that the signal is constant and the noise is random, averaging four frames reduces noise by a factor of 2, whereas averaging 16 pixels reduces the noise by a factor of 4. By using more than one electron for each gray level, confidence is increased at the expense of sensitivity. A detector with perfect collection efficiency and a noise level of 4 electrons would report 100 photons as 99 to 101 less than 10 percent of the time, but at 4 electrons per gray level, a value of 24 to 26 is reported about 40 percent of the time after background subtraction.
Relationship Between Intensity and Contrast
The term contrast is a subjective value that generally refers to the relationship between black (the absence of signal) and white (maximum signal) along with the intervening shades of gray. When viewing a linear gradient of eight monochromatic intensity steps from black to white, the transitions appear distinct (as illustrated in Figure 4(a)). As additional shades of gray are added between total black and white, the confidence in finding individual contrast steps decreases. Eventually the determination of when one shade stops and another begins is no longer evident because the noise generated by the human optic and neural processes matches the difference in the intensity step. The number of resolvable steps between black and white defines a contrast range and, therefore, the number of possible information units available from intensity. The contrast range is determined by the saturation point of the imaging system and the noise associated with each signal intensity.
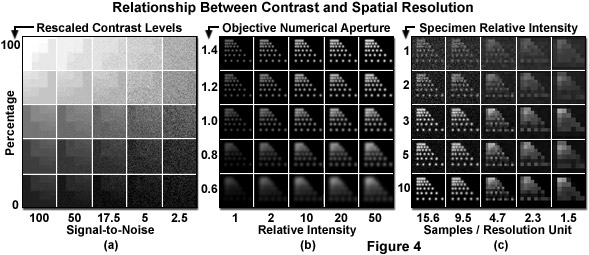
Presented in Figure 4 are several relationships between contrast and spatial resolution in optical microscopy. In Figure 4(a), a linear contrast scale from no signal to saturation has been replicated with a progressive increase in signal-dependent noise. Note that transitions between steps become increasingly more difficult to identify as the noise level increases. Spatial resolution is affected by both the objective numerical aperture and the recorded intensity (Figure 4(b)). Spacing of six points in the first column of each panel represents the resolution limits specified by the five numerical apertures listed on the vertical axis. Points in the first row are spaced just below the resolution limit for an objective of 1.4 numerical aperture, while points in the remaining rows are displayed at the resolution limit for the numerical apertures listed. As numerical aperture increases, the photons are concentrated into a smaller, brighter spot. In addition, as the relative number of photons emitted per point increases, resolving the individual points becomes easier. Finally, in Figure 4(c), the relationship between spatial sampling and signal collection is displayed. For each panel in the first column, proportionally more simulated photons were collected with the same readout noise and a 1.4 numerical aperture objective. The upper left panel represents a signal-to-noise ratio of 2. As fewer pixels are used to image the same area, the signal per pixel increases while resolution is lost.
A typical research level digital camera system has a significantly larger available contrast range than the light-adapted human eye. Although the eye has problems accurately determining more than approximately 100 shades of gray (at best), scientific-grade cameras can often resolve thousands of gray levels that lie between saturation (white) and the absence of signal (black). Adjustments to contrast are often applied after the image is captured, by scaling the relative pixel values using a tool known as the look-up table (LUT), which is available in most image acquisition and editing software packages. Scaling the image intensity values to accommodate normal human vision aids in visual interpretation of the data, but does not improve the signal-to-noise ratio.
In a monochrome (grayscale) digital image with 1000 contrast levels, if the feature under observation resides in the brighter portion of the image, it may appear washed out and difficult to identify. This phenomenon occurs because the 1000 gray levels in the image must be compressed to less than 256 values for presentation on a computer monitor and the human eye can only discern a fraction of that reduced contrast range. If the feature intensity range spans 50 contrast steps in the original image (for examples, gray levels between the values of 900 and 950), it might appear as only 5 or 10 steps on the monitor and be virtually indistinguishable to the human eye. By setting all of the image values falling below 750 to total black (gray level of 0), followed by rescaling the values between 750 and 1000 to be displayed from 0 to 255 (black to white) on the monitor, the effective contrast will be greater over the contrast range that includes the feature of interest. The feature will become more identifiable because the new contrast range is more ideally scaled for human perception. However, if the feature intensity spans only five contrast steps out of 1000 in the original image, scaling the contrast will not aid in resolving the feature identity.
At this point, the concept of contrast can now be placed into perspective with regards to image quality. Note that contrast, for the purposes of this discussion, has been defined as a relative measure of intensity, and a contrast range as the number of contrast steps that can be differentiated in an image. The decision of whether two pixels or regions of intensity constitute different contrast or intensity levels distills to a question of statistical confidence. For example, given the noise properties of an image, could one region be selected as being different from the other more than 15 times out of 20? This question is directly analogous to treating one value as signal and the other as noise, and asking if there is reasonable evidence that the signal-to-noise ratio exceeds the value of 2.7 (minimum for feature identification). The general goal for live-cell imaging is not to obtain the maximum number of possible contrast steps (in effect, the highest quality image), but rather to capture enough contrast to confidently identify the feature of interest without damaging the specimen.
Resolution in Live-Cell Digital Imaging
The simplest definition of spatial resolution is the ability to identify an intensity difference between two point sources of light. In the case where two equally bright points are translated closer together in minute stepwise increments, the points are still resolved when the intensity difference in the space between them is greater than that expected for the noise (see Figure 4(b)). In optical microscopy, the minimum resolvable distance, known as the resolution limit, is ultimately determined by the physical properties of light and the specifications of the objective. When a fluorophore is concentrated into a progressively smaller area, the resulting spot size stops shrinking (visualized in the microscope) when it reaches a diameter just larger than the resolution limit of the objective. Thus, the spot size is limited by the objective diffraction properties (numerical aperture). The two point sources discussed above appear larger at the same magnification using a low-resolution objective and smaller for a high-resolution objective (see Figure 4(b)). Therefore, two point sources spaced the same distance apart are more likely to be resolved, by the above criteria, with the high-resolution objective. By extension, an edge or a line in a high-resolution system becomes softened in a low-resolution system. As the resolving power increases, spatial variations in contrast become more distinct.
The ability to capture all of the available optical resolution in an image is limited by the spatial sampling rate (frequency) of the detector, as illustrated in Figure 4(c). For example, if the physical resolution limit of the optical system is 1 micrometer and two point sources of light are placed 3 micrometers apart, they should be resolvable. If the points appear 30 pixels apart in the image, two peaks and a valley should be apparent provided the intensity of the peaks can be confidently detected. If the peaks are imaged at a distance of 2 pixels apart, it becomes nearly impossible to determine that any differences in intensity from the intervening pixel are due to a real variation, rather than noise. The resolution is undersampled in the image and information is lost. If two points placed a quarter of a micrometer apart are imaged with the same optical system, and the image magnified so that 30 pixels span the same area, there remains no way to resolve the points in the image. In this case, oversampling will not compensate for a lack of resolution in the original image.
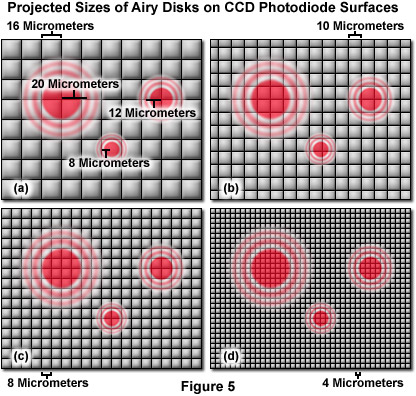
For live-cell imaging, the suggested sampling rate is between 3 and 8 pixels per resolution unit (often difficult to achieve) in order to gather the majority of the resolved information. The often suggested Nyquist sampling limit of two pixels per resolution unit is misrepresented for this type of imaging. Nyquist demonstrated that 2.3 discrete samples per minimum frequency component could be used to reconstruct the information in a signal waveform, provided that the correct basis function was employed in the process. Camera-based imaging systems, as well as most point-scanning systems, utilize a square Cartesian grid pixel array (see Figure 5). The signal is integrated between points rather than sampled at discrete points, resulting in bleed-through or non-independence in sampling for optically resolved points if there are too few pixels. Resolving feature elements in the image that are not parallel or perpendicular to the pixel array requires a greater level of sampling because the pixel centers are proportionately further apart in the Cartesian array. Finally, pixel intensities are nearly always reproduced as raw values without correction for sampling density or any underlying wavelength or pattern. Magnifying the image projected to the detector such that only two pixels cover each resolved distance will not capture all of the available information from the optical system. In many live-cell applications, signal strength is often achieved by sacrificing spatial resolution.
Illustrated in Figure 5 are images of Airy disks generated by the high numerical aperture objectives (40x, 60x, and 100x), commonly employed in live-cell imaging, projected onto the surface of pixel arrays having photodiodes varying in size from 4 to 16 micrometers. The 100x objective, with a numerical aperture of 1.4, projects a disk size that is 40 micrometers in diameter with a resolution criterion of approximately 20 micrometers. Likewise, the 60x objective (also 1.4 numerical aperture) projects a resolution unit of 12 micrometers, whereas the 40x objective (1.3 numerical aperture) produces a resolvable unit that is 8 micrometers in length. Note that the 16-micrometer photodiode array geometry is beneath the optical resolution of the microscope for all three objectives. The 10-micrometer array resolves the 100x objective with 3 pixels per resolution unit, but falls short of meeting the resolution requirements for the 60x and 40x objectives (as does the 8-micrometer array). In contrast, the 4-micrometer pixel array meets the minimum resolution requirement for the 40x objective and exceeds that of 60x and 100x objectives. A majority of the scientific digital CCD cameras now in common use have pixel sizes ranging from 8 to 16 micrometers, while many of the consumer cameras are equipped with image sensors that have smaller pixels in the 4-micrometer range. Although the pixel size is fixed in digital cameras, the optical resolution of the microscope can readily be modified to match that of the imaging system with intermediate magnification through the application of specialized couplers. However, using intermediate magnification can lead to a significant cost in terms of signal level and image quality.
The mere fact of establishing a resolution limit implies that the distance between two point sources of light cannot be measured if it lies below that limit. For example, reporting two features as being a quarter micrometer apart, using a lens with a 1-micrometer resolution limit, is highly suspect. However, a distance between two points further apart than the resolution limit can be measured with accuracy greater than the resolution limit. The center of a single, luminous point can be estimated to within 10 nanometers, dependent upon sampling rate and the signal-to-noise ratio. Therefore, the distance between any two luminous points, when greater than the resolution limit, can be measured to an accuracy in the tens of nanometers.
In conclusion, contrast and resolution are inextricably linked in the image (as illustrated in Figures 2(a) and 4(b)). Resolution is literally defined by the ability to demonstrate contrast between two points in an image. Obviously, generating contrast is required for capturing resolution by the imaging system. Similarly, as optical resolution is changed, the signal intensity per pixel, and thus the uncertainty level in feature identity, will also change. The critical idea is that resolution and contrast must be considered together when matching the information content of the image to the requirements for feature identification in the live-cell image.
Contributing Authors
Sidney L. Shaw - Department of Biology, Indiana University, Bloomington, Indiana, 47405.
Matthias F. Langhorst - Carl Zeiss MicroImaging GmbH, Koenigsallee 9-21, 37081 Goettingen, Germany.
Michael W. Davidson - National High Magnetic Field Laboratory, 1800 East Paul Dirac Dr., The Florida State University, Tallahassee, Florida, 32310.
