
Introduction
Although spectral imaging and linear unmixing is a very powerful tool to reduce or eliminate signal bleed-through artifacts in fluorescence microscopy when imaging multiply labeled specimens, one should also be aware of potential artifacts and errors that can be introduced when linear unmixing is applied without adhering to the proper experimental conditions. Among the most important considerations is to note that the success of this technique depends upon a number of factors that are within the control of the microscopist. However, perhaps the two most critical aspects for obtaining reasonable results are attention to detail during specimen preparation and the application of reference spectra that faithfully represent the true profiles of fluorophores present in the specimen. Thus, control specimens containing individual fluorophores to be used as "fingerprint" references should be imaged under the same conditions as the specimen containing a mixture of probes to be distinguished. In addition, the best results will be obtained when the signal-to-noise ratio of all fluorophores under investigation has been optimized. In all cases, saturation of the detector should be avoided and the background noise level should be kept to a minimum. Furthermore, the optical components of every microscope system are highly variable and will impose some degree of bias, rendering it virtually impossible to reliably use spectra collected from another microscope as references. As a rule of thumb, the optimum reference spectra are obtained using identical conditions to those used for acquiring the lambda stack. These conditions include using the same objective, offset, amplifier gain, wavelength range, and dichromatic mirrors. If possible, reference spectra can be measured in regions of the specimen that are labeled with only a single probe, or they can be chosen from non-overlapping regions within the lambda stack itself.
Another potential source of artifacts in spectral imaging is high background signal arising from the mounting media, the specimen itself (autofluorescence), or from lipophilic reagents often used to introduce plasmids via transfection. Reflections from laser excitation sources may also contribute to high background levels. In general, these background sources should be treated as a spectral component whenever possible (in effect, by gathering reference spectra) during linear unmixing in order to successfully separate background from specific fluorophore signals. During analysis, spectral signals that do not match those in the reference library are considered residual and are not assigned. In cases where a residual image is part of the output, however, it is possible to examine how well spectra from the reference library fit the acquired spectra. In many cases, residual signals arise from saturated pixels or from high background levels.
When preparing specimens for spectral imaging and linear unmixing, the best policy is to ensure that expression of two or more genetically-encoded fluorescent proteins is balanced and that synthetic dyes are applied in concentrations that yield similar intensities. Dramatic mismatches in intensity will saturate the detector for the most concentrated probes while those of lower intensity can easily be lost in the noise floor (in the worst case scenario). Achieving a high signal-to-noise ratio for each fluorophore in the specimen will also help to produce the best results with linear unmixing, as will carefully planning the staining regime to avoid using probes having spectra that overlap too closely. In addition, lambda stacks should be composed of wavelength bands that are representative of the spectral differences between the fluorophores. The best choice in deciding acquisition parameters for lambda stacks is to choose enough wavelength bands to record data from throughout the emission spectrum of all the fluorophores present in the specimen.
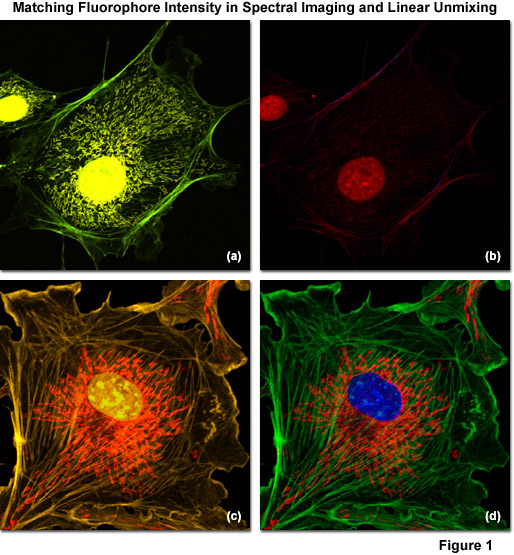
Illustrated in Figure 1 are examples of spectral imaging and linear unmixing in multiply stained adherent cell cultures having fluorophore intensities that are either unbalanced (Figures 1(a) and 1(b)) or balanced (Figures 1(c) and 1(d)). Figure 1(a) shows a bovine pulmonary artery endothelial cell (BPAE line) labeled with three green emitting fluorophores: Alexa Fluor 488 conjugated to phalloidin (filamentous actin), Alexa Fluor 514 conjugated to a cytochrome C targeting antibody (mitochondria), and SYTOX Green (nucleus). Note that the intensity of SYTOX Green is so disproportionate with respect to the other labels that signal from the two Alexa Fluor dyes is seriously compromised in the unmixed image (Figure 1(b)). In contrast, the same cell line stained with three orange fluorophores: Alexa Fluor 555 (filamentous actin), SYTOX Orange (nucleus), and MitoTracker Red CMXRos (mitochondria) produces far superior results when the fluorophore concentrations are adjusted to produce similar intensities (Figure 1(c)). After reassignment of the labeled structures with pseudocolors in the unmixed image (Figure 1(d)), The blue nucleus is visualized on a bed of red mitochondria surrounded by green actin stress fibers.
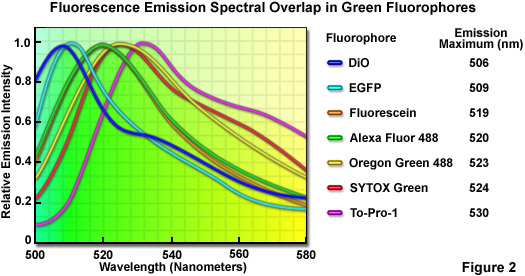
Although linear unmixing is capable of separating fluorescence spectra that are highly overlapping, there are limits in the ability of most algorithms to distinguish between fluorophores with emission spectra that are virtually superimposed. A comprehensive analysis of common green fluorophores (having emission maxima ranging from 506 to 530 nanometers; see Figure 2) demonstrated that, when mixed together in a single specimen, many of the dye combinations could be separated using linear unmixing despite their similarity. In cases where the fluorescence signal level is balanced with respect to intensity, the spectral profiles of fluorophores having wavelength maxima variations of only 4 to 5 nanometers (for example, fluorescein and Oregon Green 488; maxima at 519 and 523 nanometers, respectively) can be successfully unmixed. For probes having emission maxima separated by more than 7 nanometers (such as EGFP and SYTOX Green; maxima at 509 and 524 nanometers, respectively), linear unmixing can reliably separate the spectra, even under conditions where different signal levels occur. It should be noted, however, that fluorescent probes having spectral profiles with an excessively high degree of overlap (in effect, almost completely), such as fluorescein and Alexa Fluor 488 or SYTOX Green and Oregon Green 488, cannot be distinguished with spectral imaging and linear unmixing.
In summary, there are several practical considerations that will assist in ensuring the greatest potential for success in real-world investigations using spectral imaging and linear unmixing. Perhaps the most important aspect is to carefully gather reference spectra for all fluorophores that faithfully represent the spectra likely to be obtained from the test specimen. In this regard, all controls must (without deviation) be imaged under identical conditions. Pixel saturation and high background noise should be avoided, and autofluorescence should be taken into consideration as a component spectrum in cases where it cannot be eliminated. In addition, unwanted signal from laser lines and mounting media discontinuities can affect linear unmixing results. Finally, low signal levels arising from dispersing the emission signal over a broad spectral range can adversely affect the results of quantitative experiments. Whenever possible, fluorophore concentrations (or at least signal levels) should be as closely matched as possible to ensure optimum results.
Microscope Configuration
The microscope optical train components (mirrors, lenses, filters, beamsplitters) will impose a considerable amount of bias on reference and test measurements, so collecting spectra from other instruments is unwise and will no doubt lead to errors. In order to avoid pitfalls, reference spectra should be acquired in exactly the same manner as the lambda stack, including using the same objective, pinhole diameter, offset, amplifier gain, photomultiplier voltage (unless the gain responses are calibrated), wavelength range, dichromatic mirror, laser power, pixel dwell time (good oversampling electronics allow for flexibility), specimen mounting medium, coverslips, and immersion oil. The best approach is to determine the imaging parameters for the lambda stack first, and then acquire reference spectra under identical conditions. In specimens that exhibit considerable spatial separation of the fluorophores under consideration, it might be possible to choose non-overlapping regions from within the lambda stack itself for analysis.
Depending upon the instrument configuration, limitations on the ability of a particular microscope to perform satisfactorily in spectral imaging and linear unmixing experiments can vary widely. These limitations are usually based on the sensitivity and design of photomultiplier detectors and include low sensitivity, narrow bandwidth, and limited spectral accuracy. The bandwidth of the detection channel is one of the overriding factors in determining the sensitivity of a spectral imaging confocal microscope. The typical channel width of a standard confocal microscope ranges between 30 and 50 nanometers whereas the specially designed channels for spectral imaging instruments range from approximately 2 to 10.8 nanometers. Such a reduction in channel width limits the inherent sensitivity of the instrument by restricting the number of photons that are able to reach the detector during a given sampling period. Therefore, lambda stack acquisition with a spectral resolution of 5 nanometers or less is only useful when examining specimens that are labeled with very bright fluorophores. When imaging typical biological specimens, such high spectral resolution will likely compromise signal-to-noise and image quality. Furthermore, in systems that use a traditional diffraction grating for wavelength separation, additional signal loss can occur due to the fact that the diffraction efficiency of light is polarization dependent (this artifact has been addressed and corrected in advanced instruments). Additionally, the quantum efficiency of many photomultiplier tubes drops significantly at short and long wavelengths near the spectral limits of the photocathode. These factors should be borne in mind when planning spectral imaging experiments.
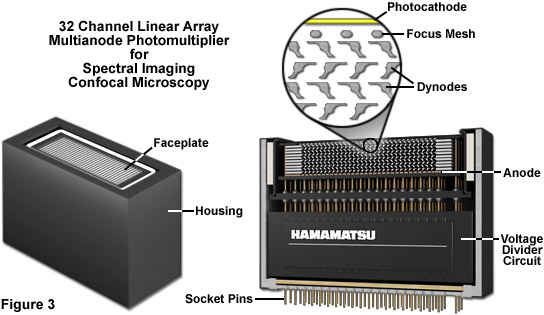
Presented in Figure 3 is the exterior and a cut-away diagram revealing the internal architecture of a 32 channel multianode photomultiplier used in high-performance spectral imaging laser scanning confocal microscopes. This versatile detector configuration greatly enhances lambda stack acquisition speed by enabling the instrument to simultaneously gather up to 32 bands of fluorescence emission light that have been separated into component colors using a diffraction grating. By employing a linear array of detection channels, multiple emission bands are imaged in parallel, thus enabling a selected spectral region to be obtained in a single scan across the specimen. In addition to dramatically increasing acquisition speed, parallel imaging minimizes photobleaching and phototoxicity, enabling significantly more images to be acquired in time-lapse experiments. In commercial confocal microscope implementations, the diffraction grating disperses the emitted fluorescence, which is then directed onto the multianode array of precisely defined bandwidth channels to generate a separate image from each channel. These detectors enable spectral imaging of living cells in culture that express fluorescent proteins with highly overlapping emission spectra.
Spectral imaging relies on the ability of the instrument to determine emission signal fluctuations that occur in specifically defined wavelength bands. The number of bands coupled to the spectral bandwidth of each band is a determining factor in how well spectra can be resolved, but the general motif dictates that better results are obtained with the largest possible number of channels. However, this statement is true only if the spectral bands have sufficient signal-to-noise. A minimum number of two channels have been applied to the spectral imaging and linear unmixing of FRET pairs, but using an even greater number of channels has the potential to produce more reliable results. In general, the best linear unmixing results are obtained when channel width is as large as possible. If the amplifier gain can be adjusted independently for each channel, signals can usually be separated to a greater degree.
Reference Spectra
One of the most important considerations for spectral imaging is that accurate reference spectra are essential in generating satisfactory linear unmixing results. Although it requires additional steps in specimen preparation, the best approach to ensure the acquisition of suitable reference spectra is to create reference specimens containing only a single fluorophore. Thus, if the experiment calls for spectral imaging and linear unmixing of a specimen expressing three fluorescent proteins, reference spectra should be collected from three individual cultures that each express only one of the fluorescent proteins. This action avoids the potential pitfalls associated with accidental contributions of other fluorophores being introduced into the reference data. Distortion of the reference spectra due to contribution from aberrant signals (including autofluorescence) results in re-assignment errors that render quantitative analysis of the data impossible. However, in sparsely labeled specimens where colocalized signals are rare, it is often possible to use the original specimens containing several labels to obtain reference spectra.
One of the major advantages in conducting spectral imaging with synthetic dyes and fluorescent proteins is that the spectral profiles of these fluorophores are accurately known. This information is useful for improving the results of linear unmixing when only the reference spectra of fluorophores known to be present in the specimen are included in the analysis. The inclusion of additional reference spectra may degrade the resulting images due to the fact that noise and spectral aberrations result in high unmixing errors. However, autofluorescence is often a significant problem (especially with fluorophores that are dim or have low abundance targets) and should be treated as a reference whenever possible. When performing transfections with fluorescent proteins, the investigator should also include a control specimen that is treated identically, but using DNA that doesn't express a fluorescent protein. This control can then be used to generate reference spectra for autofluorescence. During linear unmixing, the number of reference spectra included in the analysis can be varied in order to optimize results.
Several of the commercially available linear unmixing software packages that accompany spectral imaging confocal microscopes contain algorithms that attempt to unmix lambda stacks without requiring measured reference spectra. The algorithm searches for spectral information directly in the lambda stack by inspecting all channels sequentially for regions within each channel where no signal is present in any of the other channels. That region is then considered a pure fluorophore and used for the unmixing operation. In cases where no region can be found that is devoid of signal in the other channels, the algorithm selects an area with the lowest signal intensity in the other channels and considers that area to be a pure fluorophore. This technique is known as Automatic Component Extraction (ACE) and is mathematically based on a Principal Component Analysis (PCA). Other approaches include allowing the user to select pre-recorded spectra from a library or having the software automatically select closely matching spectra from the library. Unfortunately, using these algorithms without reference spectra generally leads to the generation of a number of artifacts in unmixed images unless images from each channel in the lambda stack contain distinct regions where only one fluorophore is localized. In practical applications, the advantages and disadvantages of the various methodology used to provide spectral reference information should be considered for each experiment. For example, failure to identify a hidden component (such as autofluorescence) can create more significant problems than having sub-optimal reference spectra derived from an automatic detection method. Modern linear unmixing software implementations often allow mixing of reference spectra with those obtained from a search algorithm (such as ACE), to combine the advantages of both techniques.
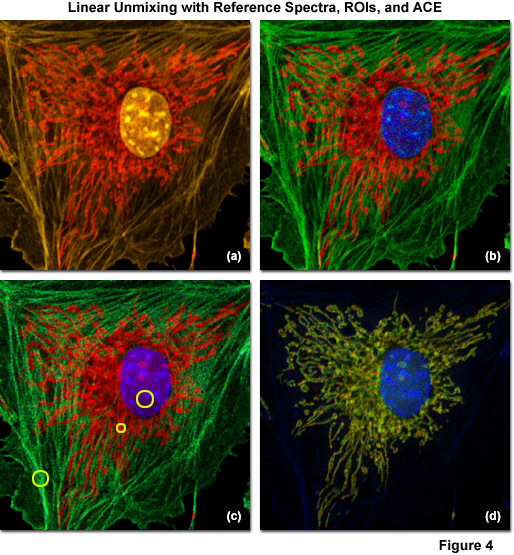
Examples of linear unmixing using reference spectra, regions of interest selected from the lambda stack, and ACE are shown in Figure 4. The specimen is identical to the adherent bovine pulmonary artery cells used in Figures 1(c) and 1(d), which were stained with Alexa Fluor 555 (labeling filamentous actin), SYTOX Orange (nucleus), and MitoTracker Red CMXRos (mitochondria). The lambda stack projection is illustrated in Figure 4(a) and the unmixed image using reference spectra gathered under identical conditions is presented in Figure 4(b). Pseudocolors for the nucleus, mitochondria, and actin are blue, red, and green, respectively. Next, regions of interest in the original spectral image stack that appeared to contain only a single fluorophore were selected and unmixed (yellow circles in Figure 4(c)). The resulting image (Figure 4(c)) exhibits more noise than the corresponding image (Figure 4(b)) created using reference spectra. Finally, ACE was used to directly unmix the multichannel images without using reference samples (Figure 4(d)). In this case, elements of the dyes used to label the nucleus and mitochondria are retained, but the filamentous actin contribution is lost. Such artifacts typically occur when the number of spectral components for which the software is searching is too low, or in cases where autofluorescence or a spurious background signal is recognized, but one of the principal fluorophores is not. Hence, it is important to conduct several trials with the software tuned to examine more spectral components than the number of fluorescent probes present in the specimen, or to add fluorophores manually from reference spectra.
Background Correction
Detector noise and background signals can significantly affect linear unmixing results. Background arises from laser line noise, mounting media inhomogeneities, immersion oil, stray light, and autofluorescence, all of which can be considered component spectra and included in the unmixing procedure. The situation becomes even more important when exciting with lasers emitting in the ultraviolet or violet regions, where glass components (the coverslip, glass microscope slides, objectives) can produce autofluorescence. Background problems are also created by improperly targeted fluorophores that contribute random signal with spectral characteristics identical to those of fluorophores that are correctly localized. High background levels are exasperated when attempting to perform spectral imaging experiments with fluorophores that provide very low signal levels. Such cases can adversely affect the linear unmixing results and render the spectral imaging approach useless. It is always a good idea to choose fluorophores that are capable of producing signals well above the background level to ensure the best results.
After gathering spectral imaging data, a strategy for subtracting background signal should be implemented. During linear unmixing, any signal that does not arise from the fluorophores should be removed by a background correction algorithm. This approach should also be applied to ratiometric measurements (such as spectral FRET assays) due to the fact that intensity-dependent artifacts can be introduced by high background signals. In most cases, background correction can be applied to a stack of images by first creating a reference image, and then subtracting that image from each member of the stack. When the background intensity is high, but spectrally homogeneous, it can be treated as an additional fluorophore and separated by linear unmixing.
Noise
Because spectral imaging and linear unmixing is a pixel-based technology, it is susceptible to errors introduced into the images by noise sources in the microscope optical and detector systems. Noise arises from stochastic fluctuations in the emission signal, as well as detector dark current and read noise. Errors arising from noise are most problematical when imaging weakly fluorescent probes in live-cell imaging scenarios where illumination intensity and exposure time must be kept to a minimum in order to preserve the specimen. Each detector channel makes its own contribution to the total noise, so keeping the number of channels to a minimum will reduce noise artifacts in linear unmixing. Thus, gathering lambda stacks with fewer channels over larger bandwidths will result in improvements over the situation where a greater number of detection channels of smaller bandwidth are employed. This type of configuration is especially critical when high detector readout noise is accompanied by weak fluorescence.
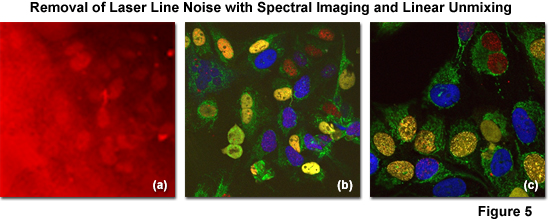
The successful removal of noise arising from laser line reflections using spectral imaging and linear unmixing coupled with (so called) main beamsplitter (dichromatic mirror) enhancement is illustrated in Figure 5. The specimen is an adherent culture of human cervical cancer epithelial cells (HeLa line) expressing EGFP fused to a mitochondria targeting sequence and Venus (a yellow fluorescent protein) fused to a nuclear localization sequence. After fixation with paraformaldehyde, the specimen was stained with Alexa Fluor 568 and 647, both targeting the nucleus. Excessive reflections (pseudocolored red) are observed in Figure 5(a) using conventional main beamsplitters in a traditional confocal microscope configuration. Applying spectral imaging and linear unmixing with conventional main beamsplitters, a significant amount of noise is removed (Figure 5(b)), but advanced instrumentation having dichromatic main beamsplitters featuring superior laser noise suppression due to a steep reflection angle (Figure 5(c); note the black background) produces the most desirable result with emission fingerprinting.
Due to the fact that multiple noise sources can be identified in microscopy, the total signal-to-noise ratio for all contributing sources in a typical measurement is strongly affected by the number of detection channels, which can lead to dark current and readout noise levels that rise significantly above other noise sources when a large number of channels are implemented. Conversely, statistical fluorescence emission shot noise is not affected by the number of detection channels and is dependent only on the intensity of the signal. In this case, fewer signals per channel generates less noise in each channel and signal averaging can be used to advantage.
Autofluorescence
Autofluorescence poses significant problems in all phases of fluorescence microscopy and whole body imaging, particularly when specimens have been prepared using paraformaldehyde or skin components are being imaged. Many fixation procedures dramatically increase autofluorescence levels to the point that they often overwhelm the signal from fluorophores used to stain specific regions in the adherent cells or tissue. Plant and neural tissues also tend to exhibit a high degree of intrinsic autofluorescence and, in addition, the transfection reagents commonly used to mediate fluorescent protein vector DNA entry into mammalian cells can increase autofluorescence signal. Spectral imaging and linear unmixing can be employed to treat autofluorescence as a separate fluorophore having a distinct emission fingerprint that can be resolved from the signals of interest. In this manner, the unwanted autofluorescence signal can be dramatically reduced or eliminated completely in the final images. Note that autofluorescence is decreased when imaging at longer wavelengths (greater than 550 nanometers) so that judicious choice of fluorophores in the red, far-red, or near-infrared spectral regions can also be an effective remedy to minimize this artifact.
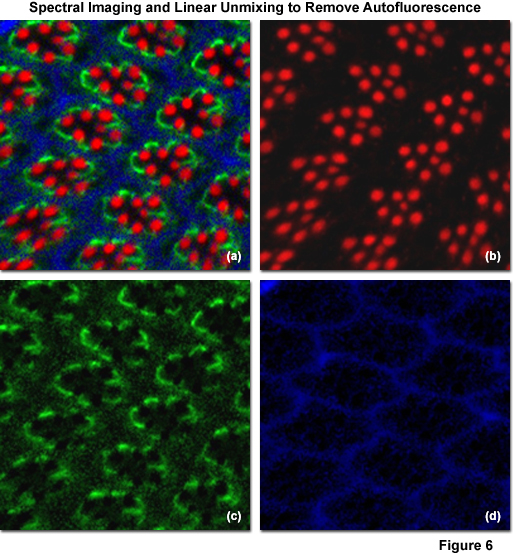
Illustrated in Figure 6 is the removal of autofluorescence in a Drosophila melanogaster (fruit fly) eye that was fixed and labeled with immunofluorescence. Autofluorescence arises from a combination of high background signal produced by chitin and pigments as well as other biomolecules naturally present in cells that fluoresce upon exposure to illumination in the cyan spectral region. In this case, autofluorescence was treated as an additional fluorophore and assigned a blue pseudocolor in the linearly unmixed image (Figures 6(a) and 6(d)). The Drosophila Crumbs gene (crb) was targeted with antibodies conjugated to the orange-emitting synthetic fluorophore Cy3 (Figure 6(b); pseudocolored red), while filamentous actin was labeled with Alexa Fluor 488 conjugated to phalloidin (Figure 6(b); pseudocolored green). Subtracting the image presented in Figure 6(d) from that in Figure 6(a) would reveal the fruit fly eye minus the contribution from autofluorescence.
Autofluorescence is often a problem when imaging fluorescent proteins (both in fixed preparations and living cells) due to the relatively low brightness exhibited by these probes when compared to synthetics such as Alexa Fluor 488. In addition, lipid-based transfection reagents can introduce significantly high levels of autofluorescence on an unpredictable basis. The brightest fluorescent proteins in the orange through red spectral regions, including tandem-dimer Tomato (tdTomato), mOrange, and mRuby, can be readily imaged with far less concern for autofluorescence, due both to the exceptional probe brightness and to the decreased excitation of endogenous fluorophores by longer wavelength illumination.
Stage Drift
Stage or focus drift during the acquisition of data for spectral imaging can lead to erroneous results. Focus drift can be minimized if the microscope is allowed to equilibrate at the operating temperature for several hours before data collection. Specialized imaging chambers or environmental control chambers that enclose the entire microscope (useful for maintaining physiological temperature of the specimen on the microscope stage) can help to eliminate stage drift. Integrated autofocus systems, which are now available from most of the manufacturers, are also useful to keep the specimen in sharp focus during the course of image acquisition. In all cases, spectral images acquired at the beginning and end of each experiment should be overlaid to determine if excessive cellular motion or focus drift occurs. When conducting FRET with spectral imaging, be aware of very large positive or negative FRET efficiencies, which may be an indicator for the presence of focus drift.
In cases where optical sections (z-stacks) are being acquired for spectral imaging, it is important to avoid excessive photobleaching of the fluorophores in the specimen, which tends to occur when repeatedly scanning a thick tissue specimen. The investigator should also check to ensure that fluorescent labeling is uniform throughout the specimen as the central portions of thick tissue specimens (greater than 20 micrometers) are usually lower in fluorophore concentration due to diffusion issues of synthetics and antibodies through the cellular matrix. In general, images for each channel of a single optical section should be captured before proceeding to the next section. When deconvolution is performed prior to linear unmixing, signal intensities in the output images should match the intensities of the input images and not scaled differently.
Conclusions
Despite the potential for artifacts and tedious specimen preparation that is necessary in order to conduct successful investigations using spectral imaging and linear unmixing, this advanced technique affords the opportunity to separate closely overlapping fluorophores that would otherwise be unresolvable using conventional methodology. Careful attention to detail is the overriding factor for ensuring that fluorophore signal intensities are matched, accurate reference spectra are gathered, and the microscope is properly configured. Continued advances in microscope and detector sensitivity coupled with improvements in linear unmixing software algorithms are driving this technology to the forefront of live-cell imaging. In the next few years, variations on the standard theme of coupling microscopes to spectrophotometers should mature to the point that spectral imaging and linear unmixing becomes an important staple in the toolbox of every cell biology laboratory.
Contributing Authors
Mary E. Dickinson - Department of Molecular Physiology and Biophysics, One Baylor Plaza BCM 335, Baylor College of Medicine, Houston, Texas, 77030.
Rene Hessling - Division of Microscopy, Carl Zeiss, Ltd., P.O. Box 78 Woodfield Road, Welwyn Garden City, Herts, AL7 1LU, United Kingdom.
Michael W. Davidson - National High Magnetic Field Laboratory, 1800 East Paul Dirac Dr., The Florida State University, Tallahassee, Florida, 32310.