


Introduction
The explosive growth in biomedical research using live-cell imaging techniques has been fueled by a combination of events that include dramatic advances in confocal microscopy instrumentation coupled with the introduction of novel ultra-sensitive detectors and continued improvements in the performance of genetically-encoded fluorescent proteins. Acquiring images of localized fluorophores in living cells on the millisecond timescales that reveal intricate biological dynamics presents a host of new challenges, which are far more complex than the traditional issues associated with creating a single high-resolution snapshot of well-stained fixed tissue in a laser scanning confocal microscope. In order to assure high image acquisition speeds of fluorescent proteins and synthetic dyes in live cells with reasonable contrast and minimal photobleaching, microscopes must be able to quickly scan the field of view and record data using detectors with high quantum efficiency. Laser scanning confocal microscopes focus a single beam on the specimen plane to sequentially point-scan a region of interest with spatial filtration of the emission light through a single pinhole that rejects light originating from regions that are out of focus.

Unfortunately, the single-beam laser confocal microscope is limited in image acquisition speed due to the need for extremely precise control of galvanometer mirrors that are used to raster scan the beam across the specimen, as well as the limited number of photons emitted by the specimen during the pixel dwell time. For generalized imaging scenarios, confocal microscopes scan at the rate of 1 microsecond per pixel, which translates to acquisition speeds ranging from one-half to two seconds per image, depending upon the dimensions. Thus, most laser scanning confocal microscopes are inadequate for capturing the millisecond dynamic events that are often essential to unraveling the intricate molecular processes occurring in living cells. Although limitations in scanning speed can be overcome by employing resonant scanning schemes, such high speed acquisitions have ultra-short pixel dwell times and therefore suffer from insufficient signal-to-noise. Many of the speed limitations associated with point-scanning confocal microscopes can be overcome by imaging the specimen with multiple excitation beams operating in parallel. Spinning disk confocal microscopes are emerging as a powerful tool for rapid spatial and temporal imaging of living cells. Although the technique was originally introduced over 40 years ago, recent improvements in microscope optical design and camera technology have significantly expanded the versatility and potential of this approach.
Illustrated in Figure 1 is a cut-away diagram of a Yokogawa Electric Corporation CSU-X1 spinning disk confocal scanning unit equipped with filter wheels and two camera ports for dual-color fluorescence imaging. This laser-based instrument represents the state-of-the-art in high speed spinning disk microscopy. The collimated excitation light produced by a diode or gas laser is optically folded and passed through a series of microlenses on the surface of the first disk before traversing the 50-micrometer pinholes in the second (Nipkow) disk and entering the microscope optical camera port. Emission light from the specimen passes back through confocal pinholes in the Nipkow disk closer to the microscope port and is directed via a dichromatic beamsplitter to a mirror in the lower part of the unit housing. A second dichromatic beamsplitter sends the shorter emission wavelengths (green) through a filter wheel to the first camera port, while the longer wavelengths (red) proceed through a second filter wheel to the second camera port. Depending upon the configuration, the CSU-X1 scanning unit is capable of reaching spinning speeds of 5,000 or 10,000 rpm, corresponding to an image capture rate of 1,000 or 2,000 frames per second, respectively.
Among the most important aspects to understand about spinning disk confocal microscopy is that the these instruments are capable of acquiring thin optical sections from specimens in a manner similar to laser scanning confocal microscopes, only much faster. Therefore, spinning disk microscopes are capable of imaging both thin and thick specimens in two (x-y) or three (x-y-z) dimensions in high spatial resolution as a function of time. The increased speed afforded by array-scanning the specimen opens the door to acquiring images at previously unattainable rates. Thus, spinning disk confocal microscopes can readily acquire two dimensional images (representing a single optical section) at relatively slow time-lapse speeds where a single frame is captured every few seconds, minutes, or hours. However, the real power of these instruments is manifested by the fact that they can rapidly acquire images in real time (approximately 30 frames per second), as well as in the ultrafast timescale that ranges up to 1,000 frames per second. In fact, the primary limitation on image capture speeds of spinning disk confocal scanners similar to the Yokogawa depicted in Figure 1 is set by the detector, as discussed below.
back to top ^Historical Perspective
Central to the design of all modern spinning disk confocal microscopes is the Nipkow disk, developed by German inventor Paul Nipkow in 1884 as a means of dissecting an image into a linear analog signal that could be electronically transmitted, and then reassembled at a remote site. Nipkow created a flat "imaging" disk by stamping a series of small squares arranged in an Archimedean spiral of constant pitch (see Figure 2) on each of two disks, one for the transmitter and another for the receiver. One revolution of the Nipkow disk is equivalent to scanning an object when the reflected light is passed through the squares onto a selenium detector, which then passes current to a lamp connected to the receiver. Viewing the lamp through a second spinning Nipkow disk recreates the original image as the lamp intensity fluctuates in step with changing current levels. Nipkow's development led to the first demonstration of television in 1926. Aside from its mechanical complexity, the primary weakness of the Nipkow disk is that light is transmitted only through a small pinhole (or square hole) rendering this technique a relatively poor mechanism for detecting or displaying image information. It is therefore evident why television technology soon dispensed with the Nipkow disk.
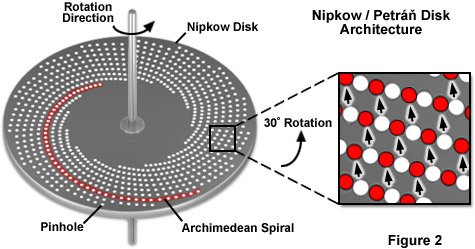
The Nipkow disk reemerged over 80 years after it was first introduced when a more advanced version (see Figure 2) was used to create the first implementation of a spinning disk confocal microscope by David Egger and Mojmír Petráň in 1967. Unlike the original Nipkow disk, which was designed to dissect an image for electromechanical transmission to a receiver, the Petráň disk was constructed to perform multiple point illumination coupled with detection in reflected light confocal imaging. Light transmission through the Petráň disk is several hundreds of times higher than through the original Nipkow disk. The schematic design of a Petráň disk for real-time confocal microscopy is illustrated in Figure 2. The pinholes are arranged in a nested cluster of Archimedean spirals of constant pitch with only a subregion of approximately 1,000 pinholes being illuminated and returning an image at any point in time. The inset in Figure 2 demonstrates how pinholes rotate to new positions (red circles) to illuminate the entire specimen as the disk spins. Images can be observed through an eyepiece or captured with a camera that is synchronized to the rotation speed of the disk.
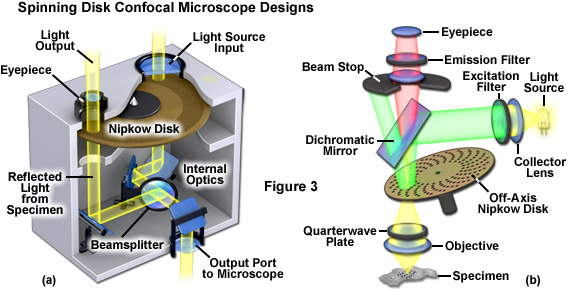
In the Petráň spinning disk microscope, illumination of the specimen and detection of the resulting images occur in tandem using pinholes on opposite sides of the disk (see Figure 3 (a)). Illumination wavefronts (provided by an arc discharge lamp) entering the pinholes proceed through the objective to the specimen, while the light reflected by the specimen is optically transferred by several mirrors and a beamsplitter to an identical set of conjugate pinholes located on the opposite side of the disk. Rerouting light originating from the specimen to a different portion of the spinning disk was implemented to prevent high intensity scattered and reflected light (originating from the illumination source and internal optical components) from reaching the eyepiece and thus obscuring specimen detail. Although a commercial version of this microscope was eventually manufactured by Noran using square pinholes, the design was so mechanically and optically complex that adjusting the internal components was difficult and scan lines were usually visible in recorded images.
Single-sided spinning disk confocal microscopes designed by Gordon Kino and Jeff Lichtman during the late 1980s utilized the same set of pinholes for both illumination and detection. These microscopes featured a simpler optical train that incorporated a number of features intended to minimize glare from the illuminated disk surface. Rather than stamping holes in a metal disk, these microscopes were fabricated with quartz disks containing a polished black chrome coating that was evaporated onto the surface followed by etching pinholes into the metallic layer. The spinning disk was located in the intermediate image plane, but placed at a slight angle so that excitation light could be reflected away from the optical axis and trapped by a beam stop (Figure 3(b)). Furthermore, the illumination was polarized before reaching the disk, and then passed through a quarter wavelength plate situated between the disk and the objective. The circularly polarized light from the specimen was then passed through an analyzer placed before the camera or eyepiece to further block any excitation light reflected from the disk surface, thus allowing the faint light from the specimen to be observed and recorded. The design presented in Figure 3(b) illustrates an alternate configuration intended for fluorescence imaging with an emission filter instead of an analyzer and an excitation filter substituting for the polarizer. In this case, the quarter wavelength plate would not be necessary due to the fact that fluorescence emission is not polarized.
Many of the first applications for spinning disk confocal microscopes were targeted at illuminating the specimen, which was usually a semiconductor wafer or similar highly reflective material, with white light through the pinholes followed by subsequent collection of light reflected from the confocal plane. Several of these instruments incorporated objectives intentionally designed to exhibit high chromatic aberration so that light of different wavelengths would focus in successive planes. The resulting images of opaque, reflective specimens are highly colored with each color representing features in a specific topographic elevation. Thus, when observing a semiconductor wafer for example, various components of the circuitry would be represented in colors that matched their axial location. In addition, these microscopes are equipped with eyepieces so that different specimen planes can be directly viewed while rotating the axial focus. Spinning disk microscopes are more rapid than the human visual flicker response rate (approximately 18 Hertz) so that the specimen can be observed by eye or captured with a camera in true color.
The early spinning disk microscopes led the way for later, more advanced designs that are in current use today. Gordon Kino's microscope was equipped with a spinning disk containing approximately 200,000 pinholes having a diameter of 25 micrometers, spinning at 2000 rpm to produce a scanning rate of nearly 700 frames per second. This pinhole size is slightly smaller than the Airy disk produced by a 100x objective having a 1.4 numerical aperture, thus producing an instrument with a resolving power similar to that of laser scanning confocal microscopes. The ability to illuminate the disk with a broadband light source has been implemented in several popular spinning disk microscope designs, which are also capable of standard epi-fluorescence using Köhler illumination when the disk is removed from the light path. Advances in optical anti-glare coatings, as well as the use of modern multi-layer dichromatic beamsplitters, excitation, and emission filters, has enabled microscope designers to build instruments that prevent virtually all excitation light from reaching the detector. Even through modern spinning disk confocal microscopes have disks that are radical departures from Paul Nipkow's original design, the disk itself is often still referred to as a Nipkow disk in the literature. Therefore, in modern nomenclature, the Nipkow disk refers to any type of spinning disk (pinhole or slit-based) instrument rather than to a specific design.
back to top ^Comparison of Laser Scanning and Spinning Disk Confocal Microscopy
The most common configuration for scanning mechanisms in laser confocal microscopes is based on using a pair of galvanometer-driven oscillating mirrors to continuously deflect the light beam angle of a collimated laser used to excite the specimen (a procedure known as scanning). On the return path, the emission light generated by fluorophores in the specimen is again deflected by the oscillating mirrors (termed descanning the emission light) and sent to the detector. One of the scanning mirrors directs the excitation and emission light along the fast axis (the horizontal direction), while the other mirror directs light along the slow axis (the vertical direction). This raster process is repeated until a two-dimensional image is acquired. Scanning of the specimen can be repeated at the same focal point over successive repetitions to capture time-lapse image sequences. Likewise, the focus can be vertically stepped up and down to acquire thin optical sections and generate a three-dimensional image stack.
Laser scanning confocal microscopy is generally limited in speed by the characteristics of the fast axis scan mirror. It is mechanically challenging to drive this mirror to oscillate at a speed that is compatible with video frame rates (30 frames per second). For example, using an image size of 512 lines (pixels) per frame, the galvanometer mirror must oscillate at just over 15,000 rotations per second. Therefore, standard video frame rates are only achievable using a resonant scanning device, where a specialized pair of mirrored galvanometer scanners is employed. A resonant scanner cannot be stopped nor adjusted for speed because it is driven by an oscillator at a predetermined frequency. However, this frequency is approximately 10 times higher than what can be achieved with fully controllable galvanometer scanners. By using a resonant scanner with a suitable resonance frequency, near-video rate image capture can be realized with a point scanning confocal microscope, however, at the expense of flexibility and often image quality (see below).
Additionally, point-scanning confocal microscopes are limited by the time the scanning spot dwells over each pixel. During the acquisition of a 512 x 512 pixel image in a single second, the scanning spot will only spend 4 microseconds on each pixel (although most instruments are capable of faster scanning). Thus, to excite detectable fluorescence in this timeframe using a well-labeled specimen, the microscope must deliver between 50 and 80 microwatts of illumination power to each spot on the specimen. Such a high level of excitation can saturate all of the fluorophores in the focused beam spot. Even a well-stained specimen will still only yield a limited number of photons within such a short time period, so that emission photon flux from the specimen results in an additional limitation to the attainable scan speed of a point scanning microscope.
One of the primary differences between the speed of point-scanning and disk-scanning microscopes is that the former builds an image sequentially one pixel at a time, while the latter multiplexes by simultaneously illuminating the entire specimen field with parallel pinholes. In point-scanners, the detector is typically a photomultiplier, which serially receives emission light as a function of time, but functions with low noise and an extremely rapid response rate. Photomultipliers are relatively inefficient and can detect only 15 to 45 percent of the fluorescence signal that passes through the pinhole (depending upon the design of the photocathode). Increasing the scanning speed is not effective because it reduces the number of detected photons per pixel to the point that noise from the photomultiplier can limit image quality. Thus, laser scanning confocal microscopes are limited in utility to investigating rather slow events that occur on timescales of several seconds or more.
In contrast, for spinning disk microscopes, the Nipkow disk is located in a conjugate image plane and a partial rotation of the disk scans the specimen with approximately 1000 individual light beams that can traverse the entire image plane in less than a millisecond. Thus, while a point-scanning confocal microscope illuminates and gathers intensity information serially (as discussed above), multiple pinholes enable the specimen to be sampled in parallel. This also means that the effective dwell time per individual pixel is largely increased in comparison to a point scanning confocal microscope operated at a similar frame rate. The larger photon collection period explains much of the difference in image quality between a resonant point scanning and spinning disk system. Such a parallel scanning strategy ties the potential in scanning speeds to the number of pinholes present in the illumination and detection system. In general, spinning disk instruments are capable of speeds that exceed those in point-scanners by 100 to 1,000 times. Additionally, by coupling a CCD camera to the microscope instead of a linear photomultiplier, spinning disk microscopes generate a parallel area-array image with less photobleaching due to the fact that the specimen can be adequately illuminated with lower excitation intensity and the emission is detected with higher quantum efficiency. Furthermore, spinning disk microscopes have no strict requirement for laser illumination and can be used with broadband-wavelength arc discharge lamps, such as mercury, xenon, or metal halide.
There are, however, several disadvantages to using spinning disk confocal microscopes that should be considered. The primary limitation is that light scattered or emitted by structures residing in regions removed from the focal plane can still reach the detector by traveling through adjacent pinholes (a phenomenon known as pinhole crosstalk). This artifact increases the background signal for thicker specimens, and therefore, ultimately reduces the axial resolution of the system. Another limitation is the low level of light transmission through the Nipkow disk, which hampers imaging of very dim fluorescent specimens. Even though low fluorescence emission intensity can be somewhat compensated by using longer exposure times, this action negates any speed advantages (however, a high quantum efficiency camera should still produce lower photobleaching with a "slow" spinning disk instrument). Among the other problems associated with spinning disk microscopes is that, in some instruments, over 90 percent of the illumination light does not pass through the disk, and when this light is reflected by the disk surface, it can result in high background levels (even from those disks with anti-reflection coatings). Also, field uniformity may be lower than in spot-scanning microscopes and often requires a correction lens or homogenization of the arc source with a liquid light guide. Finally, spinning disk microscopes do not have the inherent ability to select regions of interest for high power illumination (required in photobleaching or photoactivation experiments) followed by imaging the specimen at lower intensity.
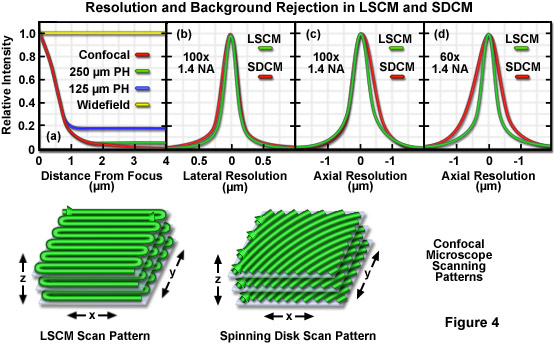
Presented in Figure 4 are graphs illustrating a comparison between background rejection (Figure 4(a)) and resolution (Figures 4(b) to 4(d)) for widefield, laser scanning confocal (LSCM), and spinning disk confocal (SDCM) microscopes. Also shown are three-dimensional cartoons of the lateral and axial scanning patterns for both confocal instruments. Background rejection in widefield, single aperture LSCM, and spinning disk microscopy with varying pinhole separation distances is illustrated as a function of distance from the focal plane in Figure 4(a). The background intensity for widefield fluorescence does not change over the range (4 micrometers) illustrated here, whereas the rejection of background signal for the laser scanning confocal microscope decreases inversely with the square of the distance from the focal plane. For the spinning disk microscopes, intensity follows that of the LSCM close to the focal plane, but reaches a plateau at distances exceeding one micrometer. Note that the larger pinhole spacing (250 micrometers) produces superior background rejection. Figure 4(b) reveals similar lateral resolution for both instruments, but slightly poorer axial resolution is obtained with the spinning disk using a 100x objective (Figure 4(c)) and significantly lower resolution with a 60x objective (Figure 4(d)). The LSCM scanning pattern rasters back and forth across the specimen plane, while the spinning disk pattern is created in a single sweep.
back to top ^Resolution in Spinning Disk Microscopy
The point-to-point lateral (x-y) resolution of a spinning disk confocal microscope is essentially the same as that in laser scanning confocal or widefield fluorescence microscopy (see Figure 4(b)). The classical Abbe equation describes the relationship between spatial resolution, the excitation wavelength, and the numerical aperture of the objective:
rAiry = 0.61 × (λEx / NAObj) (1)
In commercial spinning disk microscopes equipped with a Nipkow disk and designed for biological imaging in fluorescence mode, the pinhole diameter (D) typically ranges between 50 and 70 micrometers in diameter, whereas microscopes featuring slits rather than pinholes have a slit width ranging from 30 to 40 micrometers for the higher magnification objectives. The most useful objectives for live cell imaging have magnifications in the range of 40x to 100x and numerical apertures from 1.2 (water immersion) to 1.49 (oil immersion). The lateral resolution for these objectives, using excitation light suitable for imaging enhanced green fluorescent protein (EGFP; 490 nanometers), ranges from approximately 200 to 250 nanometers using equation (1) described above. For laser scanning confocal microscopes, if the pinhole diameter is reduced below the size of one Airy unit, resolution becomes compromised by poor signal statistics. In the case of spinning disk microscopes, D is usually significantly larger than the lateral resolution limit (see below).
In order to obtain the confocal effect in spinning disk microscopy, it is necessary to strategically place the pinholes far enough apart in a geometrical pattern that avoids emission light returned by the specimen from entering the wrong pinhole. Slit apertures, rather than pinholes, can be used to increase the transmitted light budget, but these disks are also sensitive to unintended spillover of emission into adjacent slits. Furthermore, slit scanning will result in a slight decrease in lateral resolution along the long axis of the slits (roughly by a factor of 1.2 to 1.4). Slits can be arranged as linear arrays (oriented both parallel and perpendicular) or as spirals. The major trade-off between slits and pinholes is that slits provide brighter illumination and higher signal throughput, whereas pinholes generally attain higher axial resolution. The fill factor, defined as the percentage transmission (T) through a Nipkow-style disk, is higher for slit disks than for pinhole disks when the ratio of the diameter to the distance between pinholes or slits is fixed according to the equations:
TPinhole = (D/S)2 × 1000 (2) TSlit = (D/S) × 1000 (3)
where D is the diameter of the pinhole or slit and S is the distance between pinholes or slits. To demonstrate relative light transmission capabilities between the two geometries, consider the case for pinhole and slit apertures having a 50-micrometer diameter (or width) and a 250-micrometer spacing. In this configuration, pinholes will transmit 4 percent of incident light, whereas slits will transmit five times that amount, or 20 percent. The transmission through a pinhole disk can be increased by using a smaller spacing interval between pinholes, but even reducing the spacing between adjacent pinholes in half (to 125 micrometers) only increases the transmission to 16 percent. Furthermore, decreasing the spacing distance (S) between pinholes (or slits) results in more emission light being able to return through neighboring pinholes, decreasing the axial resolution. Increasing the slit or pinhole diameter (D) also leads to a reduction in axial resolution.
As a general rule, the quality of an optical section generated by a spinning disk confocal microscope is dictated by the geometry of the detection pinholes or slits, as well as the objective numerical aperture, the wavelength of emission light, and the refractive index of the imaging medium between the specimen and the objective front lens. The optical section thickness is determined by the illumination point spread function (PSF), which is a function of the objective parameters, excitation wavelength, and pinhole or slit diameter used for spatial filtering. For very small pinholes and slits (less than 0.25 Airy disk units in size), illumination and detection become virtually identical and the influence of the pinhole size on optical sectioning can be neglected. Under these conditions, the optical section thickness can be expressed according to the following equation:
FWHMaxial = K × (λEm / n[1 - (1 - (NA/n)2)1/2] (4)
where λEm is the emission wavelength, n is the refractive index of the imaging medium, and NA is the objective numerical aperture. In this axial resolution equation (keeping in mind the requirement for small pinhole and slit sizes), K is a scalar correction factor whose value is 0.95 for a disk containing slits and 0.64 to 0.67 for a pinhole disk. Thus, for an emission wavelength profile having a maximum of 510 nanometers (similar to EGFP), an objective numerical aperture of 1.2, and an imaging medium having a refractive index of 1.33 (water), the axial resolution would be 452 and 640 nanometers, respectively, for pinholes and slits (see Table 1). As a result, if very small pinholes or slits are used, the axial resolution of a spinning disk microscope is very close to the theoretical resolving power of the objective. In cases where the diameter of pinholes and slits is identical and significantly smaller than the calculated Airy limit, slits will feature approximately 1.4 times lower axial resolution than pinholes.
In spinning disk confocal microscopy, the axial resolution is heavily dependent upon the characteristics and thickness of the specimen. As such, equation (4) is a very good approximation of the axial resolution that can be expected when examining the surface profile of a highly reflective semiconductor using an instrument having small pinholes with large distances between the pinholes and a low numerical aperture, dry objective. The typical signal arising from a highly reflective semiconductor can often be 100,000-fold higher than that obtained from a fluorescent specimen, so the pinhole diameter can be far less than one Airy unit and still yield excellent lateral and axial resolution. Additionally, the height variations in semiconductors are relatively minor, making it possible to choose a smaller pinhole spacing distance without light reflected from features outside the focal plane passing through adjacent pinholes.
A majority of the fluorescent specimens in biological applications normally require larger pinhole diameters to ensure a sufficient signal-to-noise ratio in the final confocal image. As such, pinholes or slits having diameters significantly less than 1 Airy disk unit are not applicable to standard biological imaging. In cases where larger pinhole and slit diameters are used, the detection PSF becomes larger than the illumination PSF and the actual pinhole or slit diameter must be considered in the calculation of the optical section thickness. Thus, the optical section thickness of a system with pinholes greater than one Airy disk unit can be calculated using the following equation:
FWHMaxial = [(0.88 × λEm / (n - (n2 - NA2)1/2))2 + (21/2 × n × PH / NA)2]1/2 (5)
where λEm is the emission wavelength, n is the refractive index of the imaging medium, PH is the specimen-side pinhole diameter, and NA is the objective numerical aperture. The first term of equation (5) describes the axial resolution of the optical system and is a constant for a given objective and emission wavelength. The second term describes the geometrical effects of the pinhole on the emission PSF, and this term is dominant for larger pinhole diameters. Thus, for those biological applications where pinhole diameters approaching 1 Airy disk unit or larger are needed for generating sufficient signal-to-noise, equation (5) describes the final axial resolution (separate visibility of point objects) of confocal microscopes in general.
Objective Specifications for Spinning Disk Confocal Microscopy
|
||||||||||||||||||||||||||||||||||||||||||||||||||||||||||||||||||||||||||||||||||||||||||||||||||||||||||||||||||||||||||||||||||||||||||||||||||||||||||||||||||
Table 1
Listed in Table 1 are the critical parameters that reveal lateral and axial resolution in biological and industrial spinning disk microscopy for high-magnification (40x to 100x) objectives. Among the values catalogued in Table 1 are the axial point spread function FWHM resolutions for small pinholes and slits (less than 0.25 Airy disk units in diameter), which were calculated according to equation (4), as well as those for large pinholes (50-micrometer diameter; equation (5)) using the emission maximum of EGFP (510 nanometers). Lateral resolution values presented in Table 1 were derived using the Abbe equation and the excitation maximum for EGFP (490 nanometers; equation (1)), as well as the Fraunhofer Airy disk FWHM (equation (6)) and the first Airy minima (equation (7)) formulas to determine the optimum Airy disk diameter at the wavelengths indicated in the Table header. Note that these calculations were based on specific assumptions concerning wavelength, objective specifications, refractive index, and microscope configuration, so actual results may differ substantially.
Among the major differences between laser scanning and spinning disk confocal microscopes is that the emission pinhole size is adjustable in the former whereas it is fixed in the latter. In addition, biological spinning disk microscopes use the same set of pinholes for both excitation and detection of fluorescence emission, but in laser scanning instruments, usually only the detector pinhole(s) is adjustable. For both microscope designs, increasing the pinhole diameter produces a corresponding increase in signal strength due to the fact that fluorescence emission arising from structures farther away from the focal plane can now reach the detector. However, only in spinning disk microscopy does increasing the pinhole diameter produce more excitation light (with a larger excitation spot; the excitation pinhole size in laser scanning microscopes is fixed). Thus, pinhole size is extremely important in spinning disk microscopy.
The optimal pinhole diameter or slit width for industrial spinning disk microscopes designed for imaging highly reflective specimens, such as polished metallography samples and semiconductor wafers, in reflected light mode (DR), is approximately equal to the full width at half maximum (FWHM) of the Airy disk. The relationship between the microscope optical configuration and DR is typically derived from the Fraunhofer formula and can be expressed according to equation (6). In contrast, the optimal pinhole or slit diameter for spinning disk microscopes designed for imaging biological specimens in epi-fluorescence mode (DF) is more closely approximated by the distance between the first minima of the Airy diffraction pattern (equation (7)), which is over twice as large:
DR = 0.5 × MObj × (λR / NAObj) (6) DF = 1.2 × MObj × (λEm / NAObj) (7)
In these equations, M is the objective magnification, NA is the numerical aperture, λR is the average wavelength for reflected light (550 nanometers), and λEm is the emission wavelength in fluorescence (510 nanometers for EGFP). As an example, in reflected light spinning disk microscopy, a 100x objective of 0.95 numerical aperture has a DR of 29.0 micrometers at 550 nanometers (see Table 1), whereas that of a lower magnification 60x objective is only 17.4 micrometers. Similarly, for a biological spinning disk microscope operating in fluorescence mode, a 100x objective of 1.4 numerical aperture has a DF of 43.7 micrometers at 510 nanometers (emission maximum for EGFP) and a 60x objective has a corresponding value of 26.2 micrometers. It is therefore evident that for optimum lateral resolution in spinning disk confocal microscopy, different Nipkow disks (or slit disks) having varying pinhole sizes are necessary to match the required values for objectives as a function of numerical aperture and magnification.
Most commercial spinning disk microscopes feature non-interchangeable Nipkow disks with fixed pinhole sizes, which range from 50 to 70 micrometers as previously discussed. In contrast, the only commercially available slit-based spinning disk microscope features interchangeable disks with slit sizes that are more closely matched to the objective specifications outlined in Table 1. For Nipkow disks with a 50-micrometer pinhole, the optimum objective is the 100x with a 1.2 numerical aperture (using water immersion), which is a relatively close match when imaging in fluorescence mode. All of other immersion objectives listed in Table 1 have Airy disk diameters that are smaller than this pinhole size. Likewise, for Nipkow disks with a 70-micrometer pinhole, the immersion objective producing the largest Airy pattern (100x and 1.2 numerical aperture) has a spot size that is approximately 70 percent of pinhole diameter. Using a 40x objective with this disk (the Airy disk size is approximately 25 percent of the pinhole diameter) creates a miniature image of the specimen from the light returning through each pinhole. The only option (available on some microscopes) to change Airy disk size in biological spinning disk microscopes is to install a magnifying tube lens.
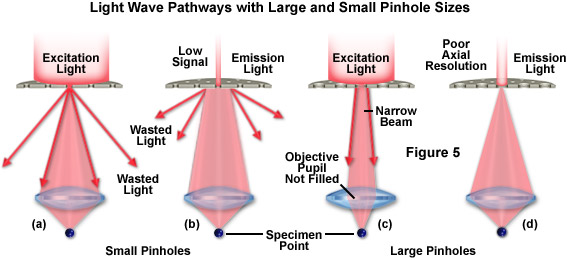
The slit sizes in biological spinning disk microscopes range in width from 13 to 38 micrometers and are more closely matched to the diameter of the Airy disks produced by the water and oil immersion objectives listed in Table 1. In fact, these microscopes are also capable of confocal imaging using objectives with magnifications of 10x and 20x. When an objective is matched to a pinhole or slit of the wrong size, a number of artifacts arise as illustrated in Figure 5. In situations where the pinhole size is too small, excitation light is diffracted by the aperture (Figure 5(a)) and overfills the objective pupil, which results in wasted light that does not reach the specimen. On return from the specimen, a considerable amount of the emission light is similarly rejected by a small pinhole (Figure 5(b)), leading to decreased signal-to-noise, as is the case with laser scanning confocal microscopes when the pinhole size is substantially decreased.
In situations where the pinhole diameter or slit width is too large, excitation light may not be adequately diffracted to completely fill the objective pupil (Figure 5(c)), thus creating a larger spot at the focal plane. This is primarily the case for incoherent illumination (as produced by arc discharge lamps) that is collimated rather than convergent. In microscopes equipped with laser illumination, the high coherence of the source ensures that light is focused into an Airy pattern regardless of the aperture size. However, the Airy pattern size will depend upon the extent to which excitation light from each aperture fills the rear focal plane of the objective. Fluorescence emission is gathered quite efficiently by a large pinhole (Figure 5(d)), but at the cost of a reduction in axial resolution (discussed above). In general, as the pinhole or slit size increases for microscopes that use the same pinhole or slit for both excitation and detection, the axial resolution decreases more rapidly for microscopes equipped with arc lamp light sources than for laser scanning confocals. However, when the optimum size is reached, the axial resolution for single and multiple beam scanning microscopes converges.
Unfortunately, equations (4) and (5) fail to account for a variety of important and practical considerations that affect fluorescence imaging in thick specimens. Biological spinning disk confocal microscopy is usually conducted with high numerical aperture objectives in order to gather sufficient light from weakly fluorescent specimens that are often in excess of 10 micrometers in thickness. In this case, the amount of light passing through adjacent pinholes (not intended) and reaching the detector is a function of both the thickness and staining pattern of the specimen. The fact that equations (4) and (5) do not account for light passing through these adjacent pinholes is a serious limitation. For very thin specimens, such as adherent cells that are largely confined to a single horizontal plane (as in a semiconductor), equation (5) is a useful tool for calculating axial resolution. However, when using typical Nipkow disk parameters of 50-micrometer pinholes and 250-micrometer inter-pinhole spacing coupled with objectives having a numerical aperture between 1.2 and 1.4, the range of specimen thickness for which equation (5) holds is limited.
Illustrated in Figure 6 is the effect of light originating from remote focal planes passing through adjacent pinholes to create a haze level that obscures the sharp specimen detail normally observed in confocal microscopy. In Figure 6(a), a portion of the red fluorescence emission arising from a theoretical specimen point reaches an objective front lens having an acceptance half-angle of 45 degrees (equal to a numerical aperture of 1.0). Fluorescence is emitted in all directions from the specimen point, which is presented as being located in the center of a pinhole in a Nipkow disk, but the diagram is restricted to show only that emission actually entering the objective. In reality, the Nipkow disk is located in the intermediate image plane (on the other side of the objective). However, the masking effect of the disk can be observed in any of the conjugate image planes, including the focal plane of the specimen, as illustrated in Figure 6. Thus, for the instructive purposes of this illustration, the pinhole is shown sampling the light near the focal plane.
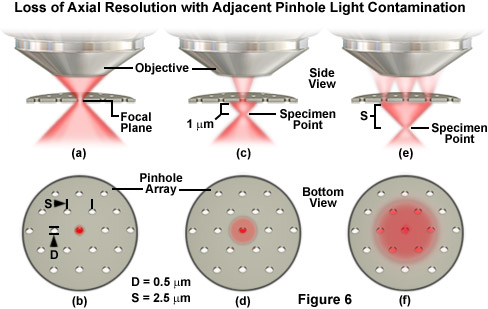
The Nipkow disk pinhole diameter in Figure 6(a) is assumed to be a single Airy pattern unit in diameter with reference to the focal plane (in effect, approximately 0.5 micrometers). It is also assumed that essentially all of the fluorescence emission representing the central maximum of the Airy disk represented by the point object proceeds through the pinhole and towards the objective. A view of the Nipkow disk from the side opposite the objective is presented in Figure 6(b), and the pinhole diameter (D; 0.5 micrometers) and inter-pinhole spacing (S; 2.5 micrometers) are indicated on the drawing. The total light transmission through a disk having a D/S ratio of 1/5 is approximately 4 percent, consistent with typical spinning disk microscopes that are not equipped with microlens arrays. Relocating the specimen point approximately 1 micrometer beneath the focal plane (Figure 6(c)) reduces the amount of light passing through the pinhole due to the fact that much of the light emanating from the point now strikes the bottom of the disk (Figure 6(d)) and is reflected from the surface.
Relocating the specimen point to a distance equal to S (2.5 micrometers) away from the focal plane enables some of the emission light to pass through the first ring of neighboring pinholes (Figures 6(e) and 6(f)). As a result, more fluorescence emission now passes through the six peripheral pinholes than through the central pinhole, mimicking the background signal haze for a highly fluorescent point source positioned away from the focal plane in a thick specimen. The situation is similar for slit disks, except that a larger fraction of the light will pass through the adjacent slits than the neighboring pinholes. Note that when the specimen point is positioned at the location in Figure 6(e), emission light is now spread over a much larger diameter on the Nipkow disk and the excitation is likewise diminished. As the specimen point is lowered still farther away from the focal plane, the number of photons passing through the disk continues to diminish until some of the emission light begins to pass through the ring of secondary neighbors when the point is approximately 5 micrometers beneath the disk.
In summary, calculations involving the axial resolution of spinning disk confocal microscopes must take into account a variety of specimen parameters in addition to the physical configuration of the microscope. The distance between pinholes or slits can be increased to improve the axial resolution at the cost of signal, but the overall performance of a spinning disk microscope is determined to a greater extent by the disk design parameters rather than whether the apertures are slits or pinholes. Critical specimen variables include staining patterns, thickness, and orientation. For those specimens where stained structures are confined to a thin layer, or where the stain is concentrated into small, but sparse regions, spinning disk microscopes can approach the axial resolution performance of laser scanning confocal instruments. However, heavily stained, thick specimens invariably will perform more poorly in spinning disk microscopes and this factor should be taken into account when planning investigations.
back to top ^Spinning Disk Microscope Design Fundamentals
The Nipkow disk, regardless of whether it contains multiple sets of spirally arranged pinholes or parallel slits, is always positioned in one of the conjugate image planes in a spinning disk confocal microscope. Pinholes or slits are illuminated from the rear of the disk (the side opposite the objective pupil) so that their vastly reduced images are focused by the objective onto the specimen plane. As the Nipkow disk rotates, the specimen is raster scanned by successive sets of miniature pinhole images or so-called "virtual" pinholes in the detector conjugate plane produced by orthogonally arranged slits. The light emitted or reflected from each illuminated point on the specimen is once again focused by the objective onto a corresponding pinhole on the Nipkow disk. Depending upon the microscope design, the exit pinhole may be the same pinhole that provided the scanning spot or it may be a pinhole that is located on the opposite side of the disk. In all Nipkow disk systems, a relatively large separation distance between adjacent pinholes (relative to their diameters) must be maintained in order to minimize crosstalk from fluorescence emission or reflected light, as discussed above. This pinhole size and spacing issue is always a tradeoff between generating enough light to successfully image the specimen and maintaining a high degree of confocality.
Among the most important considerations when designing spinning disk instruments is to ensure that the bright excitation light reflected from the surface of the disk does not reach the detector. Even though a majority of the light that does not pass through the disk is absorbed (ranging from approximately 40 to 99 percent, depending upon configuration), the level of reflected light is tremendous when compared to the weak fluorescence emission returning from a biological specimen and still significant compared to that reflected from the surface of a semiconductor. In biological fluorescence spinning disk microscopes, the reflected light can be effectively removed using barrier filters, but circular and linear polarizers are more useful in microscopes designed to image metallic surfaces. Regardless, careful manufacturing technology and critical placement of the key components can significantly improve the overall performance of disk scanning microscopes.
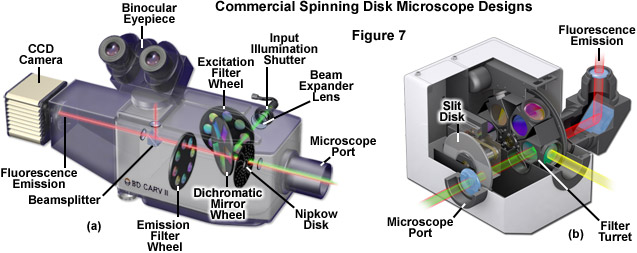
A number of commercial spinning disk scanning units have been produced over the years, both for fluorescence imaging of biological specimens (see Figure 7) and for examination of semiconductors and metallography samples. Most of the microscopes designed for observation of highly reflective materials are built around upright frames where the Nipkow disk is positioned in the vertical illuminator between the light source and the nosepiece. Because of the high light throughput in reflected light spinning disk microscopes, they are capable of incorporating disks with smaller pinholes (ranging from 20 to 45 micrometers in diameter) with larger inter-pinhole spacing (up to 250 micrometers). Several of the commercial instruments offer Nipkow disks containing two sets of pinholes, each with a different diameter and spacing that is matched to specific high magnification objectives. Reflected light and biological fluorescence spinning disk microscopes can be illuminated with traditional arc discharge or laser light sources, either coupled directly to the microscope or introduced through the scanning unit using a beam expander and collimator fed by a fiber optic cable or liquid light guide.
Illustrated in Figure 7 are cutaway diagrams of two commercial spinning disk scanning unit implementations designed exclusively for biological imaging. The CARV system (Figure 7(a)) has been passed through several manufacturers in recent years and uses 70-micrometer pinholes spaced approximately 250 micrometers apart in a spiral pattern on a single Nipkow disk to illuminate the specimen. This pinhole size is significantly above the Airy pattern limit (see Table 1) and transmits approximately 8 percent of the source light impinging on the disk. Illumination is accomplished with a metal halide or mercury arc lamp, and images can be observed using the binocular observation tubes on the scanning unit. The CARV unit is capable of imaging specimens at a rate of 1000 frames per second. A slit-based spinning disk system utilizing several interchangeable disks having different slit sizes (juxtaposed perpendicular to each other in separate groups) is presented in Figure 7(b). The unit, available as the Disc Scanning Unit (DSU) from Olympus, has disks ranging in fill factor from approximately 5 to 10 percent with corresponding slit widths covering 13 to 38 micrometers, designed to match objectives of both low and high magnification. The unit attaches to the rear microscope port and can accommodate any arc-discharge light source (including metal halide), but is not equipped by the manufacturer to handle laser systems. Direct viewing of the confocal specimen is not possible on this instrument. As discussed above (also see Table 1), spinning disk systems having slit apertures exhibit lower axial resolution than those equipped with pinholes.
The most advanced design in spinning disk instruments was engineered by Yokogawa Electric Corporation of Japan (see Figure 1) and implemented in a series of increasingly complex disk scanning units termed the Confocal Scanning Unit (CSU) comprising three models: 10, 22, and X1. These scanners are equipped with a unique architecture that consists of two coaxially aligned disks featuring a dichromatic mirror positioned between the disks (Figure 8). Each disk contains approximately 20,000 pinholes (with a 250-micrometer spacing) arranged in a series of nested spirals. The upper disk is actually a glass plate containing Fresnel microlenses on the top surface (Figure 9(b)) that direct and focus light onto perfectly aligned 50-micrometer pinholes in the lower disk for transmission to the objective and specimen. Because significantly more input illumination is gathered by the microlens disk than a regular Nipkow disk, the light throughput of this system approaches 40 to 60 percent as opposed to the 4-6 percent normally observed. As a result, even living cells expressing very low levels of fluorescent proteins are readily imaged in microscopes equipped with the Yokogawa scanning unit.
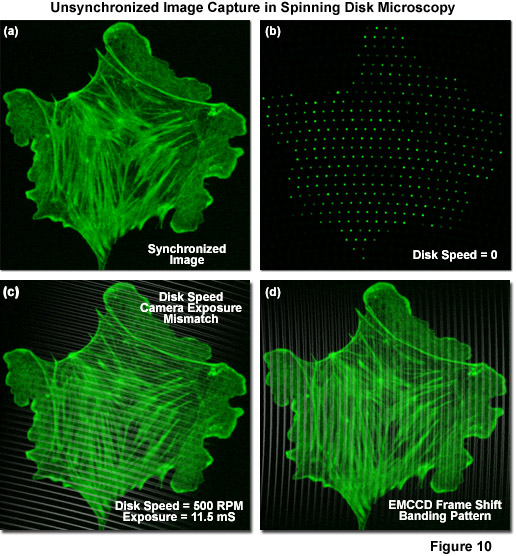
Depending upon the unit model, the Yokogawa confocal scanners have maximum disk rotation speeds of 1800 (CSU-10), 5000 (CSU-22), and 10,000 (X1) revolutions per minute, with the pinhole array pattern scanning 12 frames during each 360-degree rotation (see Figure 9(a)). These factors yield a theoretical maximum frame rate of 360, 1000, and 2000 frames per second, respectively. Although the model 22 is no longer being produced, there are likely to be a significant number of model 10 and 22 scanners remaining in the field for several years to come. Yokogawa is currently marketing the CSU-X1, which can be outfitted with two filter wheels (using two cameras) or a single filter wheel with or without an auxiliary unit that enables sequential capture of brightfield (and phase contrast or differential interference contrast; DIC) images on a single camera. The integrated filter wheels have minimal switching speeds of 33 milliseconds, which limits the acquisition speed of dual color images on a single camera unless multi-band emission filters are used (which in turn may result in bleed-through between emission channels). In practice, operation of the spinning disk unit at rates above 200 frames per second requires careful synchronization between the disk speed and camera integration time so that the pinholes traverse an integral number of frame crossings during exposures. Furthermore, considering the dimly fluorescent specimens commonly encountered in live-cell imaging, camera exposure time, rather than disk speed, often becomes the limiting factor in image acquisition rates. For example, using an electron-multiplying CCD (EMCCD) on a weakly fluorescent specimen at an exposure time of 100 milliseconds (quite common using fluorescent proteins in living cells) limits the rate of acquisition to 10 frames per second.
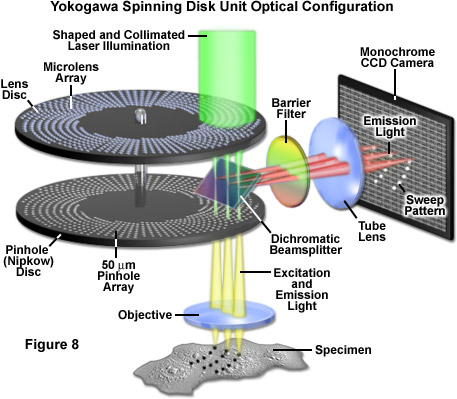
Presented in Figure 8 is a schematic diagram of the basic optical configuration in Yokogawa scanning units. Laser light introduced into the scanner through a single mode optical fiber is shaped by a specialized lens to adjust the intensity distribution of the Gaussian beam towards the center and is then projected onto the microlens disk with a collimating lens (illustrated as green light). Individual microlens elements gather a substantial amount of the incoming light (see Figure 9) and focus it through the dichromatic beamsplitter onto an area covering approximately 1,000 pinholes on the lower Nipkow disk (an area spanning 7 x 10 millimeters). The pinhole spiral patterns are designed so that a single image is created with each 30-degree rotation of the disk. Because the radial scan pitch between adjacent spirals is organized into a pattern that slightly offsets adjoining pinholes (see Figure 2), the specimen is fully raster-scanned by partially overlapping images of the pinholes.
After exiting the pinholes, the individual beams of excitation light enter and fill the objective rear aperture and are projected as a reduced image in the specimen focal plane. Fluorescence emission from the specimen is captured by the objective and focused back onto the pinhole Nipkow disk, where each conjugate pinhole now serves as a confocal exit pinhole and blocks emission from regions of the specimen not residing in the focal plane. Thus, light illuminating the specimen from a particular pinhole creates fluorescence that is gathered by the same pinhole and passed to the dichromatic beamsplitter. Because the Yokogawa beamsplitter must pass short wavelengths (excitation) and reflect long wavelengths (emission), it acts in a manner opposite to typical dichromatic mirrors used in widefield fluorescence microscopy. The emission light reflected from the beamsplitter is passed through a barrier filter to remove any remaining stray light and out-of-band fluorescence before being focused on to the surface of the CCD array of the camera system to generate an image.
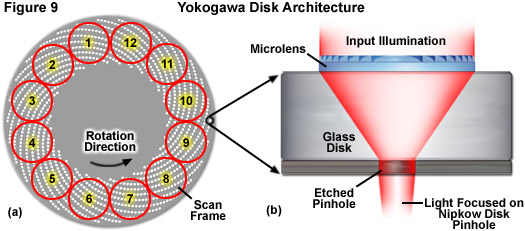
As described above, the pinhole patterns in the 55-millimeter diameter Yokogawa Nipkow disk are arranged in a series of nested spirals (see Figure 9) that complete a single scan of the specimen for every 30-degree rotation. Therefore, a complete 360-degree rotation of the disk is capable of generating 12 frames, or 2,000 images per second at the highest disk speeds. The unique disk pinhole pattern provides image frames that are homogeneously illuminated and traced evenly across the specimen by uniformly spaced scan lines. As a result, the images produced by the Yokogawa spinning disk unit are free of light intensity gradients across the field of view and do not suffer from scan line inhomogeneity, typically referred to as scanning stripes. The advanced beam shaping and collimating lenses used in the CSU-X1 substantially increase the light throughput of the scanning unit to enable imaging with reduced laser power. This results in a reduction of the fluorophore photobleaching rates (compared to laser scanning and widefield fluorescence), which allows imaging for extended periods of time.
Due to the fact that camera exposure times are dependent upon the intensity of fluorescence emission gathered by the specimen, and vary widely from one sample to another, the disk rotation speed must be carefully adjusted to match the camera exposure time. Thus, uniform image capture can only be performed if the exposure time is an integral multiple of the time necessary to sweep one scan frame (30 degrees of disk rotation). In cases where the exposure time is not matched (in effect, is not an exact multiple of the rotation speed), scanning will continue into the next frame and can produce a striped pattern superimposed on the image (see Figure 10(c)). This artifact is generally not a problem for long exposure times (greater than 100 milliseconds) where averaging occurs between frames, but can seriously hamper imaging success when exposure times are reduced to a few milliseconds. Fortunately, even though the Yokogawa disk is capable of producing 12 images from each 360-degree rotation (see Figure 9(a)), these individual segments do not have defined start and stop points so that any exposure corresponding to one twelfth of a disk rotation will capture a complete image irrespective of the point at which the exposure was started. Image banding can also occur when the frame shift of accumulated charge during EMCCD readout conflicts with the disk rotation speed (Figure 10(d)). This artifact can be addressed by pushing the vertical shift times to shorter values. The Yokogawa CSU-X1 features an advanced disk drive motor (see Figure 1) that allows for fine-tuning the adjustment of rotation speed to match the camera exposure time. Furthermore, the unit incorporates a dynamic balancing mechanism for the rotating parts to prevent vibrations (as well as accompanying imaging artifacts) that might occur at the highest speeds.
A number of advanced accessories designed to enhance performance are available for the Yokogawa CSU-X1. The high-end scanning unit versions are equipped with a computer-controlled dichromatic mirror changer that enables the user to select between three mirrors, and the 6-position auxiliary filter wheels feature stepping motors, lightweight pulleys, and a timing belt to maintain synchronization. The brightfield light path housing can be used to sequentially capture images in a variety of contrast-enhancing modes (as discussed above), including widefield fluorescence generated via an arc-discharge lamp attached to the microscope. The optical train of the brightfield unit bypasses the spinning disk system and sends images generated by the microscope directly to the camera via a series of relay lenses and mirrors. However, the switching speed of this option is approximately 2 seconds, which renders it the slowest system component for many applications. Additionally, a second camera port can be installed on the scanner (see Figure 1) so that simultaneous two-color imaging can be performed without the time delay incurred by using the filter wheel. A second dichromatic mirror is installed in the rear of the unit to divide the fluorescence emission received from the primary dichromatic into two discrete wavelength bands that are transferred to the individual cameras. The two-camera configuration provides the fastest action for capturing dual-color images of specimens labeled with, for example, enhanced green fluorescent protein (EGFP) and mCherry, an orange-red fluorescent protein.
The strategy of using massively parallel spinning disk illumination to visualize dynamic events on a variety of timescales in live-cell imaging has proven to be an indispensible tool in cell biology. Although the number of commercially available scanning unit designs is currently limited, this technology should continue to progress with incremental improvements in performance. The Yokogawa scanning unit concept is currently the most advanced Nipkow disk-based design yet implemented, and is capable of generating images of faintly fluorescent specimens with high temporal and spatial resolution. As the microscope companies address new designs targeted at fast live-cell imaging, there will no doubt continue to be advancements in spinning disk and related technologies. An alternative to the Nipkow disk concept is based on sweeping the specimen along both lateral axes with line-shaped excitation illumination. Termed line scanners, these instruments are also capable of high temporal resolution (but at the cost of somewhat reduced spatial resolution). Several commercial line-scanning instruments are being field tested as this promising concept also warrants further development.
back to top ^Detectors for Spinning Disk Microscopy
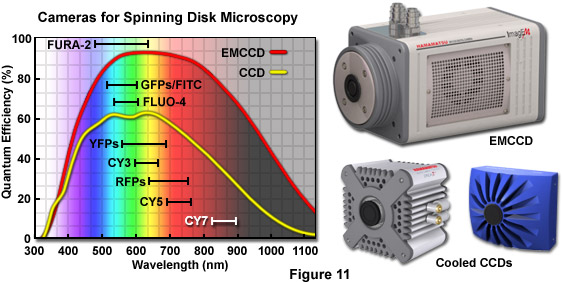
One of the primary benefits of spinning disk microscopy over point-scanning laser based confocal systems is the ability of the former instruments to produce real-time, two-dimensional images that are directly projected onto an area array CCD rather than detecting a sequential signal that varies in time and must be assembled electronically, as occurs with photomultiplier-based imaging. Furthermore, the average quantum efficiency of a front-illuminated, scientific-grade cooled CCD camera averages 50 to 65 percent in the green wavelength region whereas even the best high-performance photomultipliers are only about half as efficient. The recent introduction of back-thinned EMCCDs (see Figure 11), which have a quantum efficiency approaching 95 percent, has been a fundamental milestone in imaging of live specimens that emit fluorescence levels so low as to be virtually undetectable with standard camera systems. In the near future, complementary metal oxide semiconductor (CMOS) based cameras should emerge to dramatically increase the imaging speeds of faintly fluorescent specimens beyond the capabilities of current CCD systems.
A majority of the standard scientific CCD cameras available for low-light microscopy feature 12 to 16 bit dynamic range and have a noise floor averaging from 5 to 15 electrons per pixel (depending upon the readout speed and other design parameters). As a result, very weak signals, such as those that arise from dimly fluorescent specimens or in single-molecule imaging, are lost in the readout noise with these cameras. There are three primary sources of background noise in CCD cameras: shot noise that occurs due to the random Poisson statistics associated with collecting photons; dark noise, which is represented by the square root of the charge that leaks into a pixel during exposure and varies exponentially with the operating temperature (dark noise is halved for every 8-degree reduction in temperature); and electronic noise, which increases with the capacitance (area) of the read node and the square root of the readout speed. The readout noise in most scientific CCDs is less than 10 electrons when the chip is read at the rate of 1 MHz (a million pixels per second). Unfortunately, this level is far too high to detect single photons or even the exceedingly low light levels often encountered in spinning disk microscopes.
Before EMCCD cameras became commercially available, the detector of choice for fast imaging of faintly fluorescent specimens was an image intensifier coupled with a CCD readout. Image intensifiers operate by releasing free electrons into a vacuum when incident photons strike a photocathode. Each electron is amplified in a microchannel plate, and then accelerated onto a phosphor layer to generate a much larger number of photons that are conveyed to the CCD via a fiber-optic bridge. The gain of the intensifier is so high that the signal level corresponding to a single photon is greater than the CCD readout noise. Thus, although while the quantum efficiency is close to a photomultiplier (10 to 25 percent), the noise level of an intensifier is very low and fast gating of the signal is possible. On the downside, pixel blooming of bright signals is a significant problem, scintillations or hot pixels are frequent, and the intensifier photocathode can be permanently damaged by even brief exposure to high light intensity. Combined with the high cost, these negative factors are eclipsed by the superior performance of EMCCDs, so intensified CCDs are now seldom used in spinning disk microscopy.
The problem of increasing light signal levels high above that of a single photoelectron has led to the perfection of on-chip electron multiplication technology, from which high-performance EMCCDs have emerged. The primary distinction between an EMCCD and a traditional scientific CCD is the addition of a new horizontal register, termed the gain register, between the pixel array and the readout amplifier. In the EMCCD gain register, a higher voltage applied to one of the charge-transfer electrodes provides the gain necessary to amplify a single electron by 1,000 or more, thus rendering the signal from only a single photoelectron easily visible above the noise floor, even at high readout speeds. Eliminating read noise and reducing the dark current by multi-stage Peltier cooling (to temperatures as low as -100°C) leaves only a single major noise source known as clock-induced charge (CIC) for EMCCD cameras. CIC is produced when lattice electrons are extracted into the valence band by the charge transfer process, but can be reduced by carefully shaping the charge transfer control pulse geometry. Before the advent of EMCCDs, CIC was a little known phenomenon that is not measureable in standard CCDs.
EMCCD-based digital cameras improve the performance of spinning disk microscopes due to their single-photon sensitivity, which means these detectors can capture images on very dim specimens when a normal CCD would read only noise. Although scientific, cooled CCDs without gain registers can be combined with the Yokogawa scanning unit to produce excellent images when signal levels are high, living cells expressing fluorescent proteins at a level that mimics the natural endogenous target protein concentration are often far too dim to be recorded with these cameras. In spinning disk microscopes that lack the advanced light throughput afforded by the microlens disk, the problem is even more severe. As an example, using a Yokogawa spinning disk system coupled to a back-thinned EMCCD having a quantum efficiency of 95 percent might yield an exposure time of approximately 150 milliseconds for a specimen expressing EGFP. If this camera were substituted for a normal scientific CCD of high quality, the exposure time would either need to be increased 3 to 5 fold or the excitation light intensity dramatically increased in order to achieve the same signal-to-noise. Thus, using the more sensitive detector allows a reduction in excitation illumination, which results in less photobleaching and extended imaging times. This is very important when long-term time-lapse imaging is necessary, especially when collecting stacks of optical sections at each time point.
Currently, there are a number of excellent commercial EMCCD cameras available from the microscope companies and aftermarket camera manufacturers. These devices can be configured to match the quantum efficiency, pixel clock rate, pixel size, photoelectron well depth, and total pixel array area necessary to capture events occurring in the biological processes being investigated at frame rates approaching real time. For even faster imaging, binning or smaller chips (such as 256 x 256 pixels) will provide increased frame rates. On the downside, all currently available EMCCD chips operate using full-frame transfer, which requires the charge pattern to traverse past the image as it proceeds to the read register. This can result in streaking and moiré effects in the scan lines of spinning disk scanners even when fast vertical photoelectron transfer is implemented. In summary, EMCCDs are photon efficient, have excellent contrast, are mechanically robust, and are not damaged by exposure to bright light. Furthermore, they have single-photon sensitivity and can greatly improve acquisition speed and increase the number of images acquired before photobleaching becomes a limiting factor. The only negative aspects are a lack of fast gating capability and their much higher cost compared to traditional CCD cameras.
Spinning disk microscopy has advanced significantly in the past decade and now represents one of the best solutions for both routine and high-performance live-cell imaging applications. The high levels of excitation light throughput and advantageous versatility in coupling to virtually any inverted research-level microscope by the Yokogawa scanning unit enables investigators to match imaging requirements with a large number of microscopes and CCD camera systems. In most cases, camera exposure times, which are inextricably linked to imaging speeds, can be varied over a wide range to suit the requirements of the specimen. Imaging sensors of the future, including scientific CCDs, advanced EMCCDs, and CMOS camera systems, should be able to dramatically increase imaging speeds to enable the capture of dynamic events in living cells on timescales that were previously unattainable.
Contributing Authors
Derek K. Toomre - Department of Cell Biology, Yale University School of Medicine, 333 Cedar St., New Haven, Connecticut, 06520.
Matthias F. Langhorst - Carl Zeiss MicroImaging GmbH, Koenigsallee 9-21, 37081 Goettingen, Germany.
Michael W. Davidson - National High Magnetic Field Laboratory, 1800 East Paul Dirac Dr., The Florida State University, Tallahassee, Florida, 32310.