


Introduction
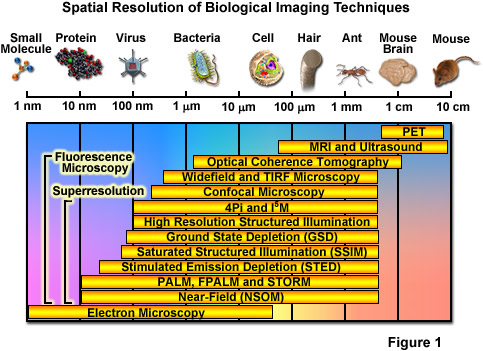
Over the past several decades, fluorescence microscopy has become an essential tool for examining a wide variety of biological molecules, pathways, and dynamics in living cells, tissues, and whole animals. In contrast to other techniques (such as electron microscopy), fluorescence imaging is compatible with cells that are being maintained in culture, which enables minimally invasive optical-based observation of events occurring on a large span of timescales. In terms of spatial resolution, several techniques including positron-emission tomography, magnetic resonance imaging, and optical coherence tomography can generate images of animal and human subjects at resolutions between 10 centimeters and 10 micrometers, whereas electron microscopy and scanning probe techniques feature the highest spatial resolution, often approaching the molecular and atomic levels (see Figure 1). Between these two extremes in resolving power lies optical microscopy. Aside from the benefits derived from being able to image living cells, the most significant drawback to all forms of fluorescence microscopy (including widefield, laser scanning, spinning disk, multiphoton, and total internal reflection) are the limits to spatial resolution that were first elucidated and described by Ernst Abbe in the late 1800s.
Currently, modern and well-established fluorescence microscopy techniques can readily resolve a variety of features in isolated cells and tissues, such as the nucleus, mitochondria, Golgi complex, cytoskeleton, and endoplasmic reticulum. Various imaging modes in fluorescence are often used to dynamically track proteins and signal peptides, as well as for monitoring other interactions in living cells. Limited spatial resolution, however, precludes the ability to resolve important structures including synaptic vesicles, ribosomes, or molecular interactions, which all feature size ranges that lie beneath the limits of detection in fluorescence microscopy. The diffraction limit in optical microscopy is governed by the fact that when imaging a point source of light, the instrument produces a blurred and diffracted finite-sized focal spot in the image plane having dimensions that govern the minimum distance at which two points can be distinguished. In the lateral (x,y) plane, the focal spot features progressively dwindling external concentric rings and is referred to as an Airy disk, whereas in the axial dimension, the elliptical pattern is known as the point-spread function (PSF). The formal expressions presented by Abbe for lateral and axial resolution in the optical microscope are:
Resolutionx,y = λ / 2[η • sin(α)](1) Resolutionz = 2λ / [η • sin(α)]2(2)
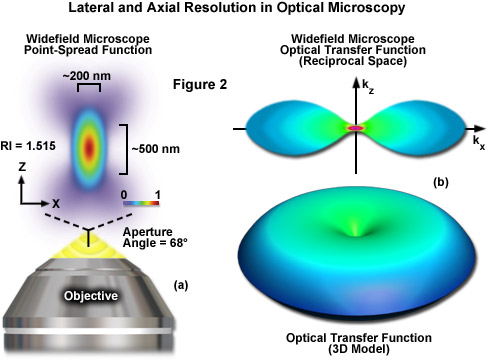
where λ is the wavelength of light (excitation in fluorescence), η represents the refractive index of the imaging medium, and the combined term η • sin(α) is known as the objective numerical aperture (NA). Objectives commonly used in microscopy have a numerical aperture that is less than 1.5, restricting the term α in Equations (1) and (2) to less than 70 degrees (although new high-performance objectives closely approach this limit). Therefore, the theoretical resolution limit at the shortest practical excitation wavelength (approximately 400 nanometers) is around 150 nanometers in the lateral dimension and approaching 400 nanometers in the axial dimension when using an objective having a numerical aperture of 1.40. In practical terms for imaging of enhanced green fluorescent protein (EGFP) in living cells, these values are approximately 200 and 500 nanometers, respectively (see Figure 2(a)). Thus, structures that lie closer than 200 nanometers cannot be resolved in the lateral plane using either a widefield or confocal fluorescence microscope.
The Abbe diffraction limit (or at least the recognition of this limit) stood for almost a century before inventive microscopists began to examine how their instruments could be improved to circumvent the physical barriers in order to achieve higher resolution. Due to the fact that axial resolution is far lower than lateral resolution (by at least a factor of two), much of the work conducted in the latter part of the twentieth century addressed improvements to performance in the axial dimension. Researchers discovered that laser scanning confocal instruments produced very modest increases in resolution at the cost of signal-to-noise, and that other associated technologies (including multiphoton, structured illumination, and spinning disk) could be used for optical sectioning, but without significant improvement in axial resolution. An important concept to note, and one of the most underappreciated facts associated with optical imaging in biology, is that the achieved microscope resolution often does not reach the physical limit imposed by diffraction. This is due to the fact that optical inhomogeneities in the specimen can distort the phase of the excitation beam, leading to a focal volume that is significantly larger than the diffraction-limited ideal. Furthermore, resolution can also be compromised by improper alignment of the microscope, the use of incompatible immersion oil, coverslips having a thickness outside the optimum range, and improperly adjusted correction collars.
Another important aspect of the fundamental resolution limit in optical microscopy is manifested by the extent of the non-vanishing portion of the instrument optical transfer function (OTF), which can be calculated using the Fourier transform of the point-spread function. The OTF defines the extent to which spatial frequencies containing information about the specimen are lost, retained, attenuated, or phase-shifted during imaging (Figure 2(b)). Spatial frequency information that is lost during the imaging process cannot be recovered, so that one of the primary goals for all forms of microscopy is to acquire the highest frequency range as possible from the specimen. In traditional fluorescence microscopy, the prevailing requirement in order to achieve this goal is to ensure that the emitted fluorescence is linearly proportional to the local intensity of the excitation illumination. Unlike the situation for transmitted and reflected light, however, fluorescence emission is incoherent due to the large spectral bandwidth and stochastic nature of electronic relaxation to produce secondary photons.
In the early 1990s, instruments featuring opposed objectives developed by Stefan Hell, Mats Gustafsson, David Agard, and John Sedat (techniques named 4Pi and I5M) were able to achieve an improvement in axial resolution to around 100 nanometers using confocal and widefield configurations, respectively. However, even though these instruments were able to produce a five-fold increase in axial resolution, lateral resolution remained unimproved. Later in the 1990s, fundamentally new microscope technology pioneered by Stefan Hell was able to overcome the Abbe lateral resolution diffraction limit, which ultimately has led to a revolution in fluorescence microscopy. As a result, a wide array of new and exciting methodologies have recently been introduced that are now collectively termed superresolution microscopy and feature both lateral and axial resolution measured in the tens of nanometers and even less. The common thread in all of the these new techniques is that they are able to resolve features beneath the diffraction limit by switching fluorophores on and off sequentially in time so that the signals can be recorded consecutively.
The most significant advances in superresolution imaging have been achieved in what is termed far-field microscopy and involve either spatially or temporally modulating the transition between two molecular states of a fluorophore (such as switching between a dark and bright state) or by physically reducing the size of the point-spread function used in the excitation illumination. Among the methods that improve resolution by PSF modification, the most important techniques are referred to by the acronyms STED (stimulated emission depletion; from the Stefan Hell laboratory) and SSIM (saturated structured illumination microscopy; pioneered by Mats Gustafsson). Techniques that rely on the detection and precise localization of single molecules include PALM (photoactivated localization microscopy; introduced by Eric Betzig and Harald Hess) and STORM (stochastic optical reconstruction microscopy; first reported by Xiaowei Zhang). As will be discussed, there are many variations on these techniques, as well as advanced methods that can combine or even improve the performance of existing imaging schemes. Even more importantly, new superresolution techniques are being introduced with almost breathtaking speed (relative to traditional advances in microscopy) and it is not unreasonable to suggest that at some point in the near future, resolution of a single nanometer may well be attainable in commercial instruments.
back to top ^Near-Field Optical Microscopy
Before briefly discussing the high resolution technique of near-field scanning optical microscopy (NSOM), it is important to distinguish between the concepts of near-field and far-field, which have been "borrowed" from electromagnetic radiation theory developed for antenna technology and applied to microscopy. There are two fundamental differences between the concepts that involve the size of the illuminated specimen area and the separation distance between the source of radiation and the specimen, but the boundary between the two regions is only vaguely defined. In near-field microscopy, the specimen is imaged within a region having a radius much shorter than the illumination wavelength. In contrast, far-field microscopy positions the specimen many thousands of wavelengths away from the objective (often a millimeter or more) and is limited in resolution by diffraction of the optical wavefronts as they pass through the objective rear aperture. Most conventional microscopes, including those used for transmitted light imaging (brightfield, DIC, and phase contrast), widefield fluorescence, confocal, and multiphoton are considered far-field, diffraction-limited instruments.
Near-field microscopes circumvent the diffraction barrier by exploiting the unique properties of evanescent waves. In practice, the nanosized detector aperture is placed adjacent to the specimen at a distance much shorter than the illumination wavelength (giving rise to the term near-field) to detect non-propagating light waves generated at the surface. Resolution is limited only by the physical size of the aperture rather than the wavelength of illuminating light, such that lateral and axial resolutions of 20 nanometers and 2 to 5 nanometers, respectively, can be achieved. Contrast is generated by refractive index, chemical structure, local stress, or fluorescence emission properties of the probes used to stain the specimen. However, the evanescent wave character of this imaging technique relegates the application of near-field microscopy in biology to examining the surfaces of cells rather than probing the more complex and interesting events occurring within the cytoplasm. Similar limitations apply to scanning probe (such as atomic force) microscopy techniques.
Because they do not require fluorescence, near-field microscopy techniques are promising for imaging of non-emissive materials, such as semiconductor surfaces or thin films using contrast mechanisms that involve Raman scattering, spectroscopy, interference, polarized light, absorption, or some other type of optical signal. Resolutions in the range between 2 and 15 nanometers have been achieved, depending on tip quality and the defined field strength. However, the specimen must have slowly varying topography (devoid of sudden valleys or hills) in order to avoid a collision with the probe and possible damage to both entities. Eric Betzig, co-inventor of PALM, obtained the first superresolution image of a biological sample in 1992 using near-field scanning optical microscopy. In recent years, NSOM has been employed to investigate the nanoscale organization of several membrane proteins, but in general, this type of approach is challenging and, as discussed above, not suitable for intracellular imaging.
back to top ^Axial Resolution Improvements: I5M and 4Pi Microscopy
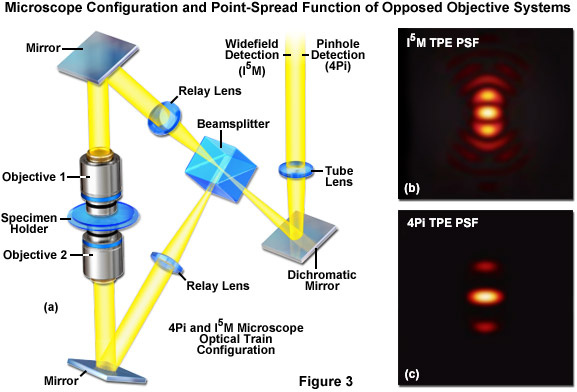
Interference between two or more excitation light sources can result in the production of a periodic pattern of illumination in the specimen plane. The interaction of this pattern with the finely detailed sub-structure of a fluorescent specimen produces emission that contains higher resolution information than is available using conventional microscopy illumination techniques. Alternatively, a similar resolution effect can be obtained when fluorescence emission is gathered by dual objectives and combined to interfere at the camera image plane. Therefore in most cases, interference microscopy configurations couple two opposed objectives that are positioned on each side of the specimen (which is sandwiched between thin coverslips; see Figure 3(a)). The use of two objectives increases the numerical aperture (expands the aperture solid angle) of the microscope to produce improved resolution. In the ideal case, the use of two objectives would result in a point-spread function that is symmetrical in the axial and lateral dimensions. Even though the names suggest perfect symmetry in the point-spread function (a full sphere has a solid angle of 4π), the interference and 4Pi microscopy techniques discussed below approach but do not quite reach this geometry. Additionally, because the quality of the interference pattern is disrupted when traveling through thick tissues, these techniques are generally limited to use with thin specimens, such as adherent cells.
The first significant improvement in resolution for far-field diffraction-limited microscopes occurred during the mid-1990s with the introduction of two techniques known as Image Interference and 4Pi microscopy. Both of these methodologies employ two opposed high numerical aperture objectives in either widefield or laser confocal fluorescence configurations to provide a large increase (down to approximately 100 nanometers) in axial resolution (Figure 3). Image interference microscopy, often denoted by the acronym InM, is a widefield technique that utilizes the juxtaposed objectives to image the same specimen plane. The simplest version, I2M, gathers fluorescence emission through both objectives and recombines the signals into a common light path at the detector. Due to the fact that the light path for each originating beam is the same length, interference of the signals produces a characteristic pattern at the image plane. A series of images gathered at varying focal planes (in approximately 35 nanometer steps) can be processed after acquisition to extract the high-resolution spatial information in the axial direction. The lateral resolution remains unchanged.
In a modification reminiscent of standing wave fluorescence microscopy (SWFM), the more advanced technique of I3M utilizes illumination through both objectives to produce excitation patterns that contain nodes and anti-nodes in the focal plane where the beams are able to constructively interfere. Due to the fact that the specimen is evenly illuminated over the entire viewfield, but excitation is restricted to the axial subsections, only the axial resolution is improved. A combination of the image interference techniques described above termed I5M is capable of achieving axial resolutions of over threefold better in confocal and sevenfold better in widefield imaging modes. Because all of the images are collected from a large field of view, data acquisition per frame is far more rapid than is typical of confocal point-scanning techniques. However, in order to maintain the sampling frequency dictated by the Nyquist criterion (two measurements per resolution unit), axial optical sections must be captured at 35 to 45-nanometer intervals. Thus, collection of an optical section stack can still require several minutes. The large side-lobes produced in I5M microscopy (as shown in Figure 3(b)) have restricted the technique to use only with fixed cells because high refractive index mounting medium is necessary for imaging.
The relatively high resolution technique of 4Pi microscopy also takes advantage of opposed objectives, but unlike I5M, convergence of the laser excitation illumination produces wavefronts that are coherently summed at a common focal point rather than the entire focal plane. In some 4Pi microscope implementations, the spherical wavefronts of fluorescence emission are coherently summed at the detector. As a result, wavefront constructive interference increases the axial resolution to approximately 100 nanometers and generates a point-spread function that is 1.5-fold narrower than confocal microscopy in the lateral dimensions and sevenfold lower in the axial direction. However, due to the fact that the enlarged wavefront is still not quite spherical, the focal spot exhibits lobes in the axial dimension above and beneath the focal plane. As a consequence, 4Pi microscopy of often used with two-photon excitation, which reduces the lobe signal due to the squaring effect (Figure 3(c)). Mathematical deconvolution of the raw image data is mandatory or optional, depending upon the microscope configuration.
back to top ^The RESOLFT Concept
The theoretical foundation necessary for achieving resolution beneath the diffraction barrier, which is actually composed of a family of physical concepts, was first advanced by Stefan Hell and associates with their introduction of the idea of reversible saturable (or switchable) optical fluorescence transitions (RESOLFT). This scheme focuses on fluorescent probes that can be reversibly photoswitched between a fluorescent "on" state and a dark "off" state (or between any two states A and B). The exact nature of the these states is variable and can be the ground and excited singlet states (S0 and S1) of a fluorophore as will be discussed below for STED microscopy, the excited singlet and dark triplet states utilized in ground state depletion (GSD) and ground state depletion-individual molecule return (GSDIM) microscopy, or the bright and dark states of a reversibly photoswitchable fluorophore (such as Cy5, kindling fluorescent protein, or Dronpa). In contrast, many of the optical highlighter fluorescent proteins, such as Eos, Kaede, Dendra2, and PA-GFP, which are capable of being permanently photoconverted from one emission bandwidth to another through covalent molecular alterations to the polypeptide backbone (and served as the foundation for the first PALM experiments), are not suitable probes for RESOLFT because the changes in fluorescent state are not reversible. The RESOLFT concept also includes switching isomerization states (such as cis-trans) and other optically bistable transitions in fluorophores.
For any given fluorophore or class of fluorescent probes, the number of switchable states is strictly limited so it is not surprising that many of the RESOLFT and single-molecule superresolution techniques described below rely on similar fluorophore switching mechanisms. In order to better understand these common properties, a close examination of the basic principles behind incoherently driven optical transitions is useful. When a molecule photoswitches from one state to the other, the probability that the molecule will remain in the first state decreases in an exponential fashion with increasing excitation light intensity. The term saturation intensity is used to define the light intensity at which the switching transition occurs (for example, when 50 percent of the molecules have transitioned from dark to bright) and is inversely proportional to the lifetimes of the two states. In situations where the excitation light intensity exceeds the saturation intensity, it becomes highly probable that one of the incoming photons will initiate the photoswitch. Fluorophores with long lifetimes in the initial and final switching states will afford more latitude in selecting excitation intensities and often exhibit higher fatigue levels (a measure of the ability to repeatedly photoswitch before being destroyed). The various fluorescent probes used for superresolution microscopy have lifetimes that differ significantly, as does the saturation intensity necessary to invoke photoswitching.
Among the differences between the RESOLFT concept (encompassing the related techniques of STED and GSD) and the single-molecule methodology employed by PALM and STORM are the switching mechanisms and the excitation light intensities necessary to photoswitch fluorescent probes. Extremely high intensities are necessary for switching off the excited singlet state with STED (using what is termed a depletion laser), but switching to a metastable triplet or similar dark state (GSD) requires a light intensity between a thousand and a million times lower. Likewise, even lower excitation intensity is capable of switching between the metastable dark and bright states of photoswitchable fluorescent proteins. Thus, the single-molecule localization techniques can accommodate less powerful light sources while providing much larger fields of view. In order to acquire coordinates of the photoswitched molecules, specific areas of the specimen are either targeted by defining scanning regions (STED, GSD, RESOLFT) or the individual fluorophores are allowed to stochastically turn on and off throughout the field of view (PALM and STORM). The different factors involved with these techniques dictate experimental parameters, such as imaging speed, instrument complexity, and the sensitivity of detection.
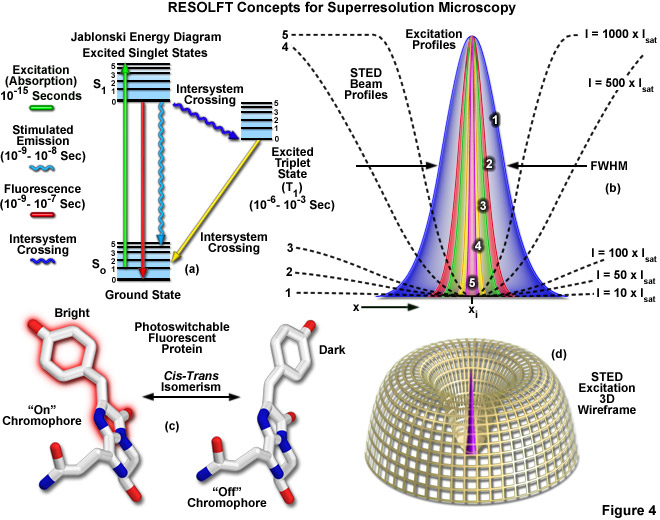
Presented in Figure 4 are several of the most important concepts surrounding superresolution imaging using RESOLFT techniques. A simplified Jablonski energy diagram (Figure 4(a)) depicts the possible electronic ground and excited states that are associated with on-off reversible optical transitions, such as the cis-trans isomerism associated with photoswitchable fluorescent proteins (as illustrated in Figure 4(c) for Kindling fluorescent protein). Depletion laser profiles 1-5 in Figure 4(b) highlight the spatial region in which the fluorophore exists in state A (or the "on" state) in regions where the standing wave of depletion light exhibits intensities between 10 (profile 1) and 1000 (profile 5) times the saturation intensity (as outlined in Equation (3)), and a zero node at xi. As the depletion laser intensity is increased, the region where the fluorophore is capable of residing in the A state is reduced to generate a subsequent increase in lateral resolution. A three-dimensional wireframe representation (Figure 4(d)) of the depletion and excitation laser profiles illustrates point-spread function modification by RESOLFT techniques.
The targeted photoswitching of RESOLFT (as generalized for STED and GSD) is performed by spatially controlling the depletion laser light intensity distribution so only that a limited number of molecules can be switched on while a majority of the others remain in the off state. Thus, when a specific wavelength having a defined intensity (that is much higher than the saturation intensity) is selected to switch the fluorophore off, applying this light in a spatially modulated manner is used to restrict the fluorophores remaining in the on state to a sharply defined region. The resolution (full width at half maximum; FWHM) for the point-spread function using these techniques is therefore defined by the following equation:
 (3)
(3)
where λ is the wavelength of excitation light and the combined term η • sin(α) is the objective numerical aperture, as described above for the classical Abbe formula (Equation (1)). The variable a is a parameter that takes into consideration the shape of the spatially modulated depletion laser beam, which is often manifested in the form of a line shape or a "doughnut" having a central zero node (see Figure 4(b)). Under the square root, Imax is the peak intensity of the depletion laser and Is is the saturation intensity for the fluorophore being imaged. In cases where Imax equals zero, Equation (3) reduces to the Abbe diffraction limit. Conversely, when Imax is much greater than the fluorophore saturation intensity (in effect, the value of the square root increases), the point-spread function becomes very narrow and superresolution is achieved. For example, when Imax/Is equals 100, the improvement in resolution is about tenfold. Thus, in agreement with theory, sub-diffraction resolution beneath the Abbe limit scales with the square root of the light intensity depleting the ground state. The resolution of all methods that rely on targeted readout of fluorescent probes, including RESOLFT, STED, GSD, and SSIM, is governed by Equation (3) regardless of the fluorophore switching mechanism or the spatial modulation geometrical parameters (doughnut or line) dictated by the microscope configuration.
RESOLFT techniques require scanning the specimen with a zero node in the depletion laser field, but not necessarily using a single beam or a zero region that is geometrically confined to a point. Multiple dark lines or zeros can also be employed in conjunction with a conventional area-array (CCD) digital camera detector, provided the zeros or the dark lines are spaced further apart than the minimal distance required by the diffraction resolution limit. Scanning only with dark lines increases the resolution in a single lateral direction, but repeated scanning after rotating the pattern followed by mathematical deconvolution can provide sub-diffraction resolution across the lateral axis. The basic requirement for scanning the specimen is the reason why RESOLFT transitions (A/B or on/off) must be reversible. Molecules in one state must be able to return to their other state when they are scanned by the zero node. Note that saturated depletion of molecules in the excited state using a zero node focal spot produces a superresolution point-spread function that is not limited by the wavelength but only by the intensity of the depletion laser.
Another attractive feature of the RESOLFT concept is that the simplest mechanism for realizing a saturated optical transition is to excite the fluorophore intensely in what can be considered an "inverse" application of the approach. In this case, the ground state (S0) is depleted and the fluorophore is expected to reside largely in the fluorescent state (S1). The same RESOLFT principles discussed above still apply, except that the reverse state is now fluorescent such that highly defined dark regions are created that are surrounded by brightly fluorescent regions. The result is a "negative" image of the specimen details, which can subsequently be inverted to generate the final image through post-acquisition mathematical processing. The dark regions can either be lines generated by interference patterns or three-dimensional doughnuts. In the case of doughnuts, the result would be dark three-dimensional volumes that are confined by walls of intense fluorescence. Saturated structured illumination (SSIM) and saturated pattern excitation (SPEM) microscopy utilize this approach with line-shaped geometries to achieve superresolution images. The primary limitation of the inverse RESOLFT technique are the mandatory computations and high signal-to-noise ratio that are required in order to obtain the final image.
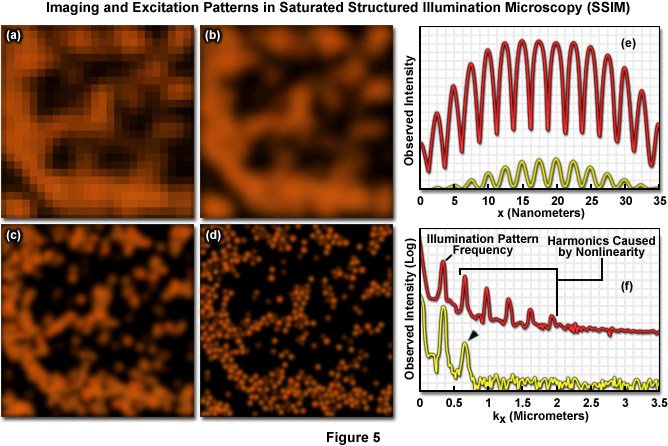
Presented in Figure 5 are high resolution images of 50-nanometer fluorescent beads along with intensity profiles generated by a uniform layer of fluorescent dye illuminated by a line pattern-modulated Gaussian beam in saturated structured illumination microscopy. In widefield microscopy the fluorescent beads exhibit poor resolution (Figure 5(a)) and appear as a blurred mass. Mathematical filtering of the widefield image (Figure 5(b)) produces scant improvement, but linear structured illumination (Figure 5(c)) yields higher resolution. The most dramatic increase in lateral resolution is achieved with SSIM (Figure 5(d)) using three harmonic orders (Figures 5(e) and (f)) during image processing. Intensity profiles through images of the thin layer of fluorescent dye with a modulation period of 2.5 micrometers are shown in Figure 5(e) at high (red curve) and low (yellow curve) peak energy densities. The lower curve closely follows the sinusoidal illumination pattern because the peak energy density lies beneath the saturation limit. In the top curve, the higher pulse energy induces fluorescence to saturate near the peaks. The Fourier transforms (Figure 5(f)) corresponding to the illumination patterns in Figure 5(e) exhibit several harmonics produced by the non-linearity of the saturating illumination intensity (red curve), whereas only the lowest harmonic is detectable in the lower energy pattern (yellow curve).
The intense excitation necessary for many of the RESOLFT techniques is compromised by the fact that high laser intensities often produce excessive rates of photobleaching so that fluorophores must be carefully chosen. Therefore, although the family of RESOLFT methods is not subject to the traditional diffraction barrier, the dependence of laser intensity on resolution gain installs another barrier that is governed by how much laser power the fluorophore can tolerate. The best remedy for this dilemma is to remove the necessity for strong intensities by implementing molecular transitions that occur with low depletion laser powers. Many bistable fluorescent probes fill this criterion and are able to be optically switched between fluorescent and non-fluorescent states through low-energy mechanisms such as photo-induced cis-trans isomerization (Figure 4(c)). In cases where both of the states are stable, the optical transition back and forth between the states can be completed at arbitrary or otherwise very long time scales, enabling the illumination to be spread out in time and reducing the required intensity (as well as photobleaching artifacts) by many orders of magnitude. Such a strategy has enabled parallelization of RESOLFT methods to allow their use in large area widefield imaging. Note that as described above, one of the principal ideas behind RESOLFT is that superresolution imaging does not necessarily require extremely high light intensities.
back to top ^Superresolution by PSF Engineering
Point-spread engineering techniques designed to circumvent the diffraction barrier all rely on a time-sequential readout of fluorescent probe photoswitching. The first technique successfully applied to superresolution biological imaging of fixed cells was the RESOLFT method named stimulated emission depletion (STED). As discussed above, STED employs spatially modulated and saturable transitions between two molecular states to engineer improvements to the point-spread function. In STED microscopy, the specimen is illuminated by two synchronized ultrafast co-linear sources consisting of an excitation laser pulse followed by a red-shifted depletion laser pulse that is referred to as the STED beam (see Figure 6). Generally, the excitation laser pulse width is of shorter duration than that of the STED pulse (although both are usually in the 10 to 300 picosecond range). Pulsed lasers take advantage of the time scales for molecular relaxation and interference of coherent light to produce radially symmetric depletion zones. Fluorophores positioned within the zero node region of the STED beam are allowed to fluoresce upon exposure to the excitation beam, whereas those fluorophores exposed to the STED beam are transferred back to their ground (non-fluorescent) state by means of stimulated emission (Figure 6(b)). The non-linear depletion (following an exponential curve) of the excited fluorescent state by the STED beam constitutes the basis for imaging at resolutions that are below the diffraction barrier.
STED takes advantage of the RESOLFT concept by significantly modifying the shape of the excitation point-spread function by manipulating the phase, pulse width, and intensity of the excitation and depletion lasers. Although both lasers remain diffraction-limited as their beams pass through the microscope optical train, the STED pulse is modified by a phase modulator to feature a zero-intensity node at the center of focus with exponentially growing intensity toward the periphery. This configuration gives rise to a doughnut-shaped beam that surrounds the central focal point (and point-spread function) of the excitation laser. Only at the exact center of focus (the node) is the intensity of the STED beam equal to zero (Figure 6(b)). The wavelength and duration of the STED beam pulse are chosen to coincide with the emission maximum and saturation intensity, respectively, of the fluorophore under investigation. Deactivation of the fluorophores occurs throughout the focal volume except at the center of focus. At the high depletion laser powers used for STED (often exceeding 250 megawatts per square centimeter), the fluorophores are almost instantaneously driven to the ground state by stimulated emission. Substantially reducing the laser power (as discussed below) enables formation of a non-fluorescent state via a number of other mechanisms, including driving the fluorophores into a metastable triplet state, formation of charge-transfer states, or photoswitching.
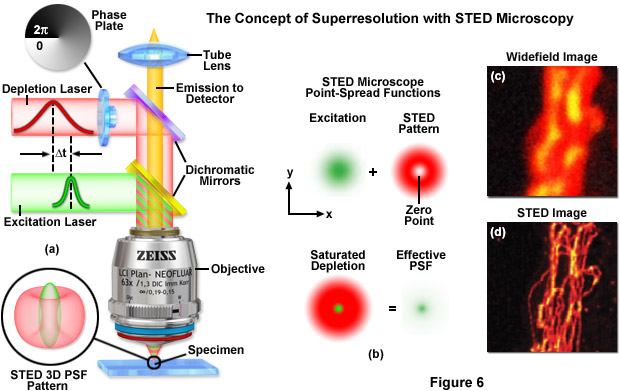
A typical STED optical train configuration is presented in Figure 6(a) showing the phase plate, excitation and depletion lasers (red and green beams, respectively), dichromatic mirrors, tube lens, and objective. A three-dimensional drawing showing the STED beam profiles at the specimen plane is also shown. Excitation and depletion are accomplished with synchronized laser pulses that are focused by the objective onto the specimen plane. Fluorescence emission is registered on a photomultiplier detector (not shown). The focal spots produced by the STED and depletion lasers are simulated as green and red patterns, respectively, in Figure 6(b). The green laser excitation spot is superimposed on the red STED depletion laser profile to dramatically reduce the size of the effective point-spread function. Comparison of widefield (Figure 6(c)) and STED (Figure 6(d)) images of microtubules stained with Alexa Fluor 594 demonstrate the increased spatial resolution afforded by point-spread function engineering methodology.
The doughnut-shaped depletion laser wavefield in STED effectively narrows the point-spread function of the excitation laser to increase resolution beyond the diffraction limit, which in the best cases can approach 20 nanometers in the lateral dimension. Sharpening of the focal spot through point-spread function engineering is thus equivalent to expanding the microscope spatial frequency passband. In order to obtain a complete image, the central zero produced by the STED lasers is raster scanned across the specimen, similar to the action of a confocal microscope. Among the benefits of STED microscopy are that the effective resolution increase is completely dictated by the experimental configuration and the laser powers applied to the specimen. Furthermore, the image is recorded as the beam scans along the specimen and requires no additional processing, and image acquisition times can approach the speed of any laser scanning confocal microscope. The effective resolution increase with STED is proportional to the power of the depletion laser, but can become problematic at extremely high laser powers that are likely to result in rapid photobleaching and destruction of the probe. Regardless, a wide range of fluorophores have been successfully used with STED (see Table 1), including fluorescent proteins, ATTO dyes, Alexa Fluors, DyLights, and several other synthetics.
Advanced versions of STED have been implemented to address improvements in axial resolution for three-dimensional superresolution imaging of ensembles. By coupling two STED depletion lasers with an opposed objective 4Pi-style configuration, Stefan Hell and co-workers have succeeded in generating significantly improved resolution in both the lateral and axial dimensions. The technique has been termed iso-STED due to the fact that it yields a tunable, nearly isotropic (spherical) point-spread function with a resolution approaching 40 nanometers along the axes. Such a symmetrical focal spot should prove beneficial in obtaining high resolution optical sections from deep within biological cells and tissues. The complex instrument configuration consists of dual STED lasers that are combined and sent to both objectives using a beamsplitter. Digital image processing can additionally be employed to reduce the effect of side-lobes and other artifacts that compromise the point spread function. A more compact and simpler STED instrument based on a supercontinuum laser source has been designed for three-dimensional imaging using a single lens to gather optical sections at a lateral resolution of 45 nanometers and an axial resolution of approximately 100 nanometers.
Properties of Selected Fluorescent Probes for STED Microscopy
|
||||||||||||||||||||||||||||||||||||||||||||||||||||||||||||||||||||||||||||||
Table 1
The same RESOLFT principles described above for STED microscopy also hold for ground state depletion (GSD) microscopy where the fluorescent probe is also photoswitched to the off state using a laser featuring a central zero node. In GSD, the photoswitching mechanism involves transiently shelving the fluorophore in a metastable dark triplet state (T1). Electronic transitions to metastable energy levels are typically "forbidden" by electric dipole selection rules due to the requirement of a spin flip, which means they occur only with very low probability. Regardless, the triplet state can be populated by repetitively exciting the fluorophore to the first excited singlet state (S1) to increase the probability of a non-radiative intersystem crossing from S1 to T1. Electrons remain in the metastable state for relatively long durations, which can range from microseconds to milliseconds. The depletion laser power necessary to drive fluorophores into the triplet state (usually several kilowatts per centimeter squared) is significantly less that that required for STED microscopy.
Among the greatest challenges for implementing GSD microscopy is choosing suitable fluorescent probes due to the potential involvement of fluorescent dark states in photobleaching. In addition, those fluorophores that can be effectively driven to the triplet state must be able to recover after removal of the depletion laser. Fluorescence recovery is mission-critical because GSD relies on scanning the specimen in a manner similar to confocal and STED microscopy. In short, the fluorophores trapped in the triplet state must be able to relax to the ground state before the depletion beam moves to the next spatial location. Thus, in GSD microscopy there must be a finely-tuned balance between the optical shelving time, the intersystem crossing rate, and photobleaching activity. The number of potential fluorophores and demonstrations of GSD imaging have been limited, but theoretically there are many fluorescent probes that might be successfully imaged using this technique.
Similar to STED, the depletion laser in GSD microscopy is shaped with a helical phase ramp on a circularly polarized wavefront to generate a doughnut-like geometry with a zero node in the center. Raster scanning the specimen with superimposed lasers (excitation and depletion) generates images with sub-diffraction resolution. Note that there is a potential for fluorophores to be shelved in other dark states (other than the metastable triplet) using GSD microscopy, but the technique will still produce excellent high resolution images provided the fluorophores are eventually able to return to the ground state. The ability to exploit saturation of the triplet state with GSD using much lower depletion laser powers stems from the millisecond lifetime of the dark state. Furthermore, the low light levels employed by GSD microscopy facilitates the use of digital cameras when imaging is conducted with a parallelized array of intensity zeros. Optical shelving in the triplet state has been demonstrated in common synthetic probes, such as ATTO dyes, rhodamine, carbocyanines, Alexa Fluors, BODIPYs, and fluorescein. Among the imaging media found to be useful for GSD are polyvinyl alcohol, aqueous solvents, and several commercially available mounting media formulations.
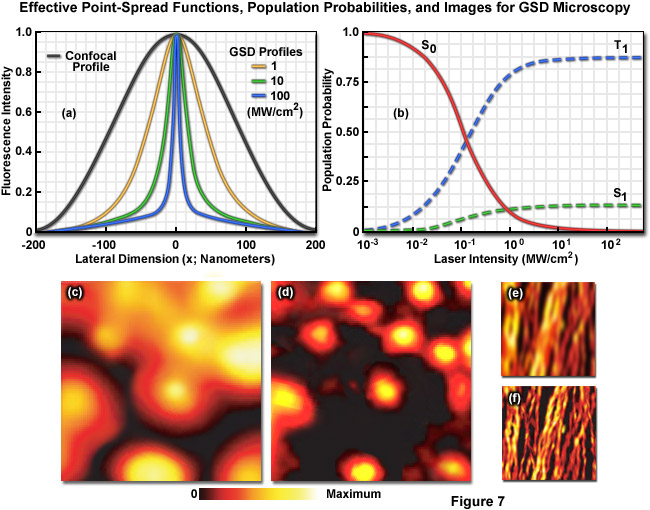
Illustrated in Figure 7 are the effective point-spread functions (Figure 7(a)), population densities of the electronic excited states (Figure 7(b)), and typical images (Figures 7(c) through 7(f)) for widefield and GSD microscopy. As depletion laser power is increased in GSD mode from one to 100 milliwatts (Figure 7(a)), the effective point-spread function decreases to a full width at half maximum of 90 nanometers, 33 nanometers, and 12 nanometers, respectively. The population probability of the ground state (S0, red curve) versus the first excited singlet state (S1, green curve) and the forbidden triplet state (T1, blue curve) as a function of laser excitation intensity for a traditional fluorophore (fluorescein) is presented in Figure 7(b). Note the dramatic increase in triplet state population as the laser power is increased. Images of fluorescent beads in widefield fluorescence (Figure 7(c)) and with GSD (Figure 7(d)) demonstrate the dramatic improvement in resolution, as do images of microtubules (Figure 7(e), widefield and Figure 7(f), GSD) labeled with a synthetic fluorophore.
In the non-linear structured illumination techniques named saturated pattern excitation microscopy (SPEM) and saturated structured illumination microscopy (SSIM), the ground state (S0) is depleted by saturated excitation (to the S1 state) through an inverse RESOLFT scheme that enables the fluorescence generated by this transition to be recorded on an area-array detector. These techniques are performed using a grid-like array of line-shaped intensity maxima and minima rather than the typical doughnut-shaped phase modulation that is utilized by STED and GSD. The saturated excitation produces narrow line-shaped dark regions in the zero nodes that are surrounded by high levels of fluorescence signal to generate a "negative" imprint of the features being imaged. Thus, in SPEM and SSIM, it is the off state of a fluorescent probe (rather than the on state) that is confined by the phase modulation zero node. The grid lines are rotated several times to generate data for a single image, which is retrieved mathematically during post-acquisition processing.
In SSIM and SPEM, structured illumination is produced by two powerful interfering light beams from a single laser that form a standing wave grid pattern projected across the lateral dimensions of the specimen. Only the first diffraction orders (+1 and -1) are used to create the interference pattern and the zeroth order from the laser source is blocked with a beam stop. Most of the exposed fluorescent probes within the specimen saturate due to exposure to the intense illumination, leaving only narrow dark line-shaped volumes (zero nodes) having a period of approximately 200 nanometers at the edges of the interference pattern. As the excitation energy is increased, the walls surrounding the nodes become much larger, thus reducing the size of the point-spread function. The methodology is implemented on widefield, non-scanning microscopes by phase-shifting the pattern to render otherwise unresolvable superresolution information visible in the form of harmonic frequencies and fundamental moiré fringes. Due to the fact that resolution is only improved in the direction perpendicular to the line-shaped zero nodes, the pattern must be shifted in several directions to cover a large number of angles in the focal plane.
Non-linear structured illumination techniques are similar to STED microscopy in that the time to conduct measurements is theoretically independent of labeling density, and photostability of the fluorescent probes dictates performance. The mechanism by which resolution is increased in SSIM and SPEM is described in terms of Fourier components and spatial frequencies. However, similar to the other point-spread function engineering techniques of STED and GSD described above, non-linear structured illumination microscopy takes advantage of steady-state saturation where high resolution information is obtained only after the system has reached fluorophore-saturating conditions. Additionally, spatial resolution scales with the level of saturation to generate images having a lateral resolution in the vicinity of 50 nanometers under optimal conditions of signal-to-noise and low photobleaching. Because of the time necessary to rotate the projected grid pattern, the specimen must be motionless for relatively long periods of time, but the fluorophores suitable for SSIM and SPEM do not require specialized photoswitching properties.
back to top ^Superresolution Structured Illumination Microscopy
In traditional implementations of structured illumination microscopy (exemplified by the ZEISS ApoTome), a grid created by evaporating metal on the surface of an optical-grade glass window is inserted into the field diaphragm plane in the illumination pathway of a fluorescence microscope and projected onto the specimen. The projected grid image is translated over the specimen using a plane-parallel glass plate that is tilted back and forth in the light path. At least three raw images of the specimen are acquired with the grid structure superimposed in different positions. These images are subsequently processed in real time using the microscope software to create an optical section. The underlying principle is that the projected grid becomes visible in the focal plane as a result of specimen features being excited by the structured light. In regions where no light reaches the specimen (in effect, the dark grid lines), no fluorescence is generated. The software determines grid contrast as a function of location and removes the out-of-focus image information before collating the three images into a final optical section having lateral and axial resolution that is similar to laser scanning confocal microscopy.
Lateral resolution can be increased over the classical Abbe limit by a factor of two (approximately 100 to 120 nanometers) in structured illumination without discarding any emission light using laser-generated spatially structured illumination coupled to a widefield fluorescence microscope in what is termed superresolution (SR) SIM. Similar to the non-linear superresolution technique of SSIM described above, the linear SR-SIM structured light wavefronts render normally inaccessible high-resolution information available in the form of moiré fringes that contain harmonic frequencies from the specimen that are not available in conventional fluorescence microscopy. Thus, if two fine patterns are superposed in a multiplicative fashion, a beat pattern (moiré fringes) will appear in their product. In this case, one of the patterns is the spatial fluorophore distribution in the specimen and the other is the structured excitation light intensity. As described in more detail below, by gathering a set of images with the grid pattern rotated throughout 360 degrees in lateral space, high resolution information can be recovered from the specimen after post-acquisition processing has been completed.
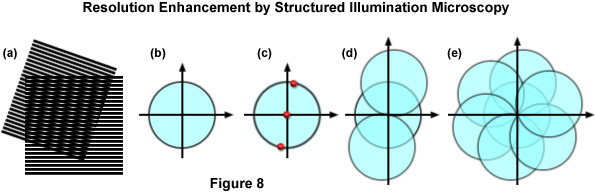
The concept of resolution enhancement using high-resolution structured illumination is schematically diagrammed in Figure 8. Two line patterns are shown superimposed (multiplied) in Figure 8(a) to produce moiré fringes that are manifested as nearly vertical stripes in the overlap region. If the specimen structure is viewed in reciprocal space (in effect, the Fourier transform), as presented by a circle having a radius of 2NA/λ in Figure 8(b), low resolution information resides near the origin, while the higher resolution information is distributed outward approaching the boundaries of the circle (approximating the diffraction limit of about 200 nanometers). Therefore, the circle in Figure 8(b) denotes the observable region of reciprocal space defining specimen details available with a conventional diffraction-limited fluorescence microscope. Structured illumination does not alter this physically observable region, however, it relocates new information into the region from higher spatial frequencies that would normally be excluded.
In the simplest example, an illumination structure that consists of a sinusoidal stripe pattern generates a Fourier transform having only three non-zero points (see Figure 8(c)). One point resides at the origin and the other two are offset from the origin in a direction that is defined by the orientation of the grid pattern and by a distance proportional to the inverse line spacing of the grid. When the specimen is illuminated by structured light generated by the grid pattern, moiré fringes will appear that represent information that has changed position in reciprocal space. In addition to the normal diffraction-limited specimen information, the observable region now contains new high frequency information that originates in the two offset regions as illustrated in Figure 8(d). The regions of the offset circles in Figure 8(d) that fall outside the central circle represent new information that is not accessible with a conventional microscope. If a sequence of such images with different grid orientation and phase is produced (Figure 8(e)), information can be recovered from an area twice the size of the normally observable region to increase lateral resolution by a factor of two.
In terms of instrument configuration, lasers are perhaps the most suitable choice for SR-SIM illumination provided the light is spatially scrambled and linearly polarized. The orientation of the grid lines should be parallel to the polarization vector azimuth of the excitation illumination, and all diffraction orders except the first (+1 and -1) should be blocked. Approximately 80 percent of the light is usually diffracted into the first orders to produce a high-contrast pattern having a periodicity of approximately 200 nanometers. The modulation depth of the stripe pattern projected onto the specimen should lie between 70 and 90 percent and the grating is mounted on a rotatable, closed loop translation device. Several grating sizes should be available to match multiple laser line excitation sources. Some commercial instruments are capable of choosing three or five grid rotations (of 120 degrees or 72 degrees) to optimize either imaging speed or resolution, respectively. After acquisition, the multiple sub-images for each grid orientation and translocation are processed through a number of software steps to generate the final image. In optimized speed mode, a commercial SR-SIM instrument should be capable of live-cell imaging of structures that lack significant motion, such as actin, mitotic chromosomes, mitochondria, and the Golgi apparatus.
The original version of high-resolution structured illumination microscopy improves lateral resolution to approximately 100 nanometers, and was the forerunner for continued developments designed to increase the axial resolution as well. Three-dimensional SR-SIM utilizes three beams generated by the diffraction grating to form a three-dimensional interference pattern in the focal plane. By gathering structured illumination images from multiple focal planes, image processing of the data maintains the 100-nanometer lateral resolution, but extends the axial resolution to approximately 300 nanometers (almost twice as good as laser scanning confocal microscopy). The axial resolution can be further improved using a combination of SIM with I5M by employing two opposing objectives to maximize gathering of fluorescence emission over a larger angle. The resulting configuration should be capable of yielding 100-nanometer resolution along all axes.
back to top ^Single-Molecule Localization Microscopy
The superresolution techniques of 4Pi, InM, STED, GSD, SSIM, and structured illumination are designed to image an ensemble of fluorophores distributed throughout the specimen. Although these methods feature different resolutions, they all excite multiple fluorophores within the confines of the modified point-spread function provided by the particular instrument configuration. In contrast, the single-molecule techniques of photoactivated localization microscopy (PALM), stochastic optical reconstruction microscopy (STORM), and fluorescent photoactivation localization microscopy (FPALM) are fundamentally different in that they image sparse subsets containing individual molecules that are separated by distances exceeding the Abbe resolution limit. The basic principle underlying these techniques is that the position of a single molecule can be localized with an accuracy of several nanometers (or better) if enough photons can be gathered and there is a lack of additional (similarly emitting) molecules within a range of approximately 200 nanometers. Among the most desirable features of PALM, STORM and related methodology is that the techniques do not require modification of the optical characteristics of a standard inverted microscope and can be implemented with any commercial instrument that is capable of performing single-molecule imaging.
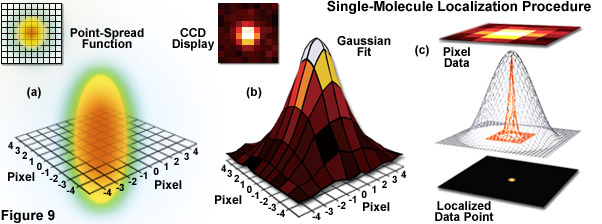
Illustrated in Figure 9 are the steps involved in localizing single molecules with high precision by fitting the point-spread function to a Gaussian function. In Figure 9(a), the point-spread function of a widefield fluorescence microscope is superimposed on a wireframe representation of the pixel array from a digital camera in both two (upper left) and three-dimensional diagrams. The pixelated point-spread function of a single fluorophore as imaged with an EMCCD is shown in the upper left of Figure 9(b), and modeled by a three-dimensional Gaussian function, with the intensity for each pixel color-mapped to a spatial location on the imaging grid (Figure 9(c)). In cases where two single-molecule locations overlap due to emission by fluorophores with a separation distance shorter than the diffraction limit, the centroid for each fluorophore can be individually localized by subtracting the point-spread function of one fluorophore from the other (after it enters a dark state or is photobleached) due to the temporal mapping strategy for generating PALM images.
For densely labeled specimens (as is common for biological structures labeled with fluorescent proteins or immunofluorescence coupled with synthetic dyes), localization accuracy does not directly translate into superresolution images due to the fact that overlapping images of simultaneously emitting fluorophores prevent their accurate localization. To circumvent the "ensemble nature" of virtually all biological specimens with fluorescent labels, PALM and STORM are designed to determine the precise localization of individual single-molecule emitters by sequentially switching the fluorescence "on" in limited subsets of the molecules before attempting to determine coordinates. Unlike STED and GSD, where the precisely defined point-spread function created by superimposed lasers is scanned across the specimen to excite all molecules within the focal volume, single-molecule techniques rely on stochastic photoswitching where most of the molecules remain dark. Upon excitation with an activation laser at low power, a small percentage of the molecules are stochastically switched on, imaged, localized, and then photobleached to remove them from the ensemble (see Figure 9). Repeating this process for multiple cycles is the creative idea behind single-molecule localization microscopy that enables the reconstruction of a superresolution image.
The concept of identifying and localizing individual molecules was first described by Werner Heisenberg in the 1930s and was formally buttressed with a solid mathematical foundation during the 1980s and 1990s by several groups. Basically, in a lateral specimen field containing single molecule emitters, the central portion of each diffraction-limited spot recorded on a digital camera image plane corresponds to the position of a molecule and can be localized with high nanometric precision by gathering a sufficient number of photons. Methods for determining the center of localization are based on a statistical curve-fitting of the measured photon distribution to a Gaussian function. The ultimate goal is to determine the center or mean value of the photon distribution (μ = x0,y0), and its uncertainty, the standard error of the mean, σ, according to the equation:
 (4)
(4)
where N is the number of photons gathered, a is the pixel size of the imaging detector, b is the standard deviation of the background (which includes background fluorescence emission combined with detector noise), and si is the standard deviation or width of the distribution (in direction i). The index i refers to either the x or y direction. The first term under the square root on the right-hand side of Equation (4) refers to the photon noise, whereas the second term encompasses the effect of finite pixel size of the detector. The last term takes into account the effect of background noise. By applying these simple techniques, a localization accuracy of approximately 10 nanometers can be achieved with a photon distribution of around 1000 photons when the background noise is negligible. Extension of this insight has resulted in a host of ingenious experiments studying isolated structures that are separated by less than the diffraction limit, such as labeled molecular motors. A major technological development in supporting probe-based superresolution is the widespread availability and ease of use of electron multiplying charge-coupled device (EMCCD) camera systems, which have single-photon sensitivity.
As described by Equation (3), the key to high-precision results for molecular localization in single-molecule superresolution imaging is to minimize background noise and maximize photon output from the fluorescent probe, a task easier described than accomplished. In the best case scenario, if 10,000 photons can be collected in the absence of background before the fluorophore bleaches or is switched off, the center of localization can be determined with an accuracy of approximately 1 to 2 nanometers. In contrast, if only 400 photons are gathered, the localization accuracy drops to around 20 nanometers or worse. Background in superresolution specimens arises from natural or reagent-induced autofluorescence (from fixatives or transfection chemicals), as well as from residual fluorescence of surrounding probes that have entered the dark state. Thus, for probe-based single-molecule superresolution imaging techniques such as PALM, the fluorescent molecules should display a high contrast ratio (or dynamic range), which is defined as the ratio of fluorescence before and after photoactivation. Variability in contrast ratios in fluorescent proteins and synthetic fluorophores is due to differences in their spontaneous photoconversion in the absence of controlled activation.
Single-molecule imaging was initially demonstrated in 1989, first at cryogenic temperatures and later at room temperature using near-field scanning optical microscopy. Since that time, the methodology has evolved to being a standard widefield microscopy technique. The prior knowledge that the diffraction-limited image of a molecule originates from a single source enables the estimation of the location (center) of that molecule with a precision well beyond that of the diffraction limit. An early application of the concept was presented with a technique known as fluorescence imaging with one-nanometer accuracy (FIONA) that localizes and tracks single-molecule emitters by finding the center of their diffraction-limited point-spread function. FIONA was used to successfully demonstrate the step size in nanometers with extremely high precision of myosin motors as they translate down the length of actin filaments. Another demonstration termed nanometer-localized multiple single molecule fluorescence microscopy (NALMS) uses photobleaching to selectively remove single molecules in order to measure distances between identical fluorescent probes that overlap within a diffraction-limited spot.
Several other single-molecule techniques with interesting acronyms have also been reported. A technique known as single-molecule high-resolution imaging with photobleaching (SHRImP) is related to FIONA and uses photobleaching of two or more closely spaced identical fluorophores to sequentially determine their position using single-molecule localization techniques starting from the last fluorophore that has been bleached. Likewise, a two-color version of FIONA using fiduciary markers to measure the registration between two detection channels has been introduced under the name of single molecule high-resolution colocalization (SHREC). The application of continuous specific or non-specific binding of diffusible fluorescent probes to a fixed biological target followed by photobleaching for high-resolution imaging has been termed point accumulation for imaging in nanoscale topography (PAINT). Other investigations have focused on using individual quantum dots for localization studies based on their stochastic entry into dark states, whereas separating and localizing individual fluorophores differing in their spectral profiles has been the target of several experiments designed to isolate single molecules at high resolution.
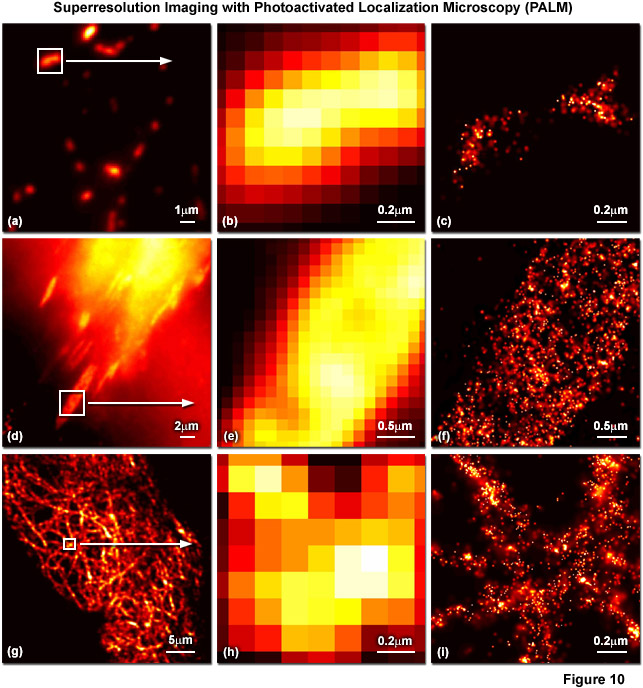
Presented in Figure 10 are several examples of superresolution images generated using PALM coupled with the fluorescent proteins, tandem dimer Eos (tdEos) and monomeric Eos version 2 (mEos2). Figures 10(a) through 10(c) show tdEos fused to a short mitochondrial targeting signal in widefield total internal reflection (Figure 10(a)) as well as the boxed region in Figure 10(a) expanded to the size of the PALM image (Figure 10(b)), and the corresponding superresolution PALM image (Figure 10(c)). Likewise, images of tdEos fused to vinculin are captured in focal adhesions in widefield (Figure 10(d)), expanded (Figure 10(e)), and PALM (Figure 10(f)). Note the finely detailed structure of the focal adhesion in the PALM superresolution image. A fusion of mEos2 to human cytokeratin is presented in widefield (Figure 10(g)), expanded (Figure 10(h)), and PALM (Figure 10(i)) to illustrate the dramatic increase in resolution afforded by PALM imaging. In all cases features ranging in size from 30 to 50 nanometers are resolved with high localization precision.
The major drawback of the single-molecule techniques described above is that they are only useful when the fluorescent probes are well isolated from one another, usually at densities somewhere between 10 and 100 molecules per square micrometer. Such a large intermolecular spacing ensures that the centroid distribution of each probe can be accurately fitted. However, none of these methods specify a distinct molecular mechanism that enables the sequential readout of individuals from a large ensemble of fluorophores, and it was not until photoswitching (or photoconversion) between two distinct emission states was applied in PALM and STORM imaging that stochastic superresolution microscopy became a reality. These techniques demonstrate that single-molecule imaging can be used to study dense concentrations of fluorescent probes (in the range of 100,000 per square micrometer) while still achieving a resolution measured in tens of nanometers. Thus, with the optical highlighter fluorescent proteins or photoswitchable carbocyanine dyes, an activation laser applied at low power is used to trigger emission switching so that any particular molecule has a small probability of being photoactivated, but the majority of the population remains in the original (dark or native) emission state.
In PALM, STORM and related single-molecule localization techniques, the activated state of photoswitchable molecules must lead to the consecutive emission of sufficient photons to enable precise localization before the probes re-enter a dark state or become deactivated by photobleaching. Ensuring that the sparsely activated molecules are further apart than the Abbe limit is critical to enable the parallel recording of many individuals, each having distinct coordinates that produce unique diffraction spots on the area-array detector of a digital camera. As described above, the centroids derived from images of these individual molecules yield molecular coordinates having a precision based on the number of emitted photons. Once the molecular positions are ascertained, the coordinates are registered as a tick mark in the lateral dimension and the process is repeated. Due to the fact that the number of emitted photons varies for each molecule, a minimum brightness threshold (for example, those molecules emitting more than 25 photons) can be established to achieve the desired resolution.
Variations of PALM and STORM include a technique known as PALM with independently running acquisition (PALMIRA) where the camera is operated at high speed without synchronization to the activation laser or the off-on-off switching cycles of the fluorescent probes. PALMIRA requires the use of reversibly switchable fluorophores, but dramatically accelerates image acquisition speeds (by approximately 100-fold). Another method referred to as ground state depletion with single-molecule return (GSDIM) populates the dark state of a synthetic fluorophore by driving it into a metastable triplet state (similar to GSD microscopy), followed by monitoring emitters as they stochastically return to the ground state. A number of similar techniques have emerged that take advantage of this and related phenomena, including blink microscopy and many other derivatives denoted by a seemingly endless stream of new acronyms. The most significant potential afforded by these new methods is that they are able to generate superresolution images using standard synthetic fluorescent probes, such as fluorescein, Alexa Fluor 488, ATTO 650, Cy5 and many similar dyes in the presence of oxygen scavengers and aliphatic thiols.
Although the single-molecule superresolution techniques have proven to be extremely precise in their ability to localize fluorescent probes in the lateral dimensions, achieving similar resolution in the axial dimension has proven to be more difficult. The three-dimensional version of STORM (3D-STORM) adapts a cylindrical lens to skew the point-spread function of single-molecule fluorescence in the lateral direction depending on its position along the z-axis. Biplane (BP) FPALM employs a dual plane imaging configuration to project an image of the same molecule into two different focal planes. A technique named double-helix point-spread function (DH-PSF) engineers the point-spread function of the microscope into two lobes, which are rotated with respect to the image depending on their axial position. Finally, interferometric PALM (iPALM) gathers light from single emitters using twin juxtaposed objectives, recombines the emission, and uses interference of the photons based on their location in the focal plane to determine the axial position. Even though most of these techniques designed to increase axial resolution fall short of their performance in the lateral dimensions, iPALM is actually capable of yielding axial resolution comparable or better than PALM in the lateral dimension.
High density molecular localization techniques are still in their infancy as new examples are being developed and reported on a regular basis, however, many of the concepts discussed above hold significant promise to ultimately become everyday tools in cell biology and related disciplines. At this point, many of the published examples of ensemble and single-molecule superresolution methodology are concerned primarily with proof of principle or the introduction of new fluorescent probes. Favored target molecules in these investigations are actin and microtubules, which are excellent resolution tests since they feature distinct, well-characterized cellular structures and typically have numerous filaments at 25-nanometers or less in diameter and located at various distances from each other. Examples of two-color and live-cell imaging are reported far more infrequently, but all of the methods described here will likely become more refined and therefore useful for investigating a wide range of biological phenomena.
Conclusions
The broad range of superresolution techniques available today are moving optical imaging of biological specimens into the realm traditionally held by electron microscopy, but some caution is warranted when interpreting the structures and molecular distributions that are observed. The major emphasis should be to assure that the techniques perform as advertised and do not create new artifacts that must be interpreted and alleviated. In most cases, the techniques, software, and instrumentation described in the paragraphs above have been developed by only a few brilliant and creative scientists, so there is quite a bit of room for expansion of this embryonic field. For many of the superresolution instruments, the component parts are commercially available or can be easily fabricated, which essentially boils down to a question of expense. In the case of PALM and other molecular localization techniques, the instrumentation has been available for some time in the form of commercial TIRF systems, but the manufacturers already have turnkey systems in the offering. Likewise, the ensemble techniques of STED, structured illumination, and 4Pi are commercially available and additional instruments should appear in the next few years. These events should be a boon to cell biologists who are unable to build their own instruments and/or program software, but want to conduct experiments at high resolution.
Contributing Authors
Mats G. L. Gustafsson, Eric Betzig, and Harald F. Hess - Howard Hughes Medical Institute, Janelia Farm Research Campus, Ashburn, Virginia, 20147.
George H. Patterson - Biophotonics Section, National Institute of Biomedical Imaging and Bioengineering, National Institutes of Health, Bethesda, Maryland, 20892.
Jennifer Lippincott-Schwartz - Cell Biology and Metabolism Program, Eunice Kennedy Shriver National Institute of Child Health and Human Development, National Institutes of Health, Bethesda, Maryland, 20892.
Michael W. Davidson - National High Magnetic Field Laboratory, 1800 East Paul Dirac Dr., The Florida State University, Tallahassee, Florida, 32310.