


Introduction
Over the course of the past several decades, a variety of imaging modalities in fluorescence microscopy have emerged as powerful tools for probing the spatial and temporal dimensions in fixed and living cells and tissues to uncover structural and dynamic information. Widefield, confocal, multiphoton, and related fluorescence techniques are able to retrieve data from a specimen at resolutions approaching the wavelength of light based on the fluctuating distribution of fluorescently labeled entities that are unevenly distributed throughout the lateral and axial planes. Limitations in optical resolution for the microscope were first discovered in the late 1800s by Ernst Abbe who, together with Lord Rayleigh, created the foundation for modern microscopy by linking the imaging process to diffraction theory. In essence, microscope resolution is restricted by the diffraction of light at the objective rear focal plane, which creates a diffraction barrier that dictates a maximum resolution of approximately 200 nanometers in the lateral (x,y) dimension and 500 nanometers in the axial (z) dimension, depending upon the objective numerical aperture and the average wavelength of illumination. The diffraction barrier stood as an obstacle to high resolution imaging for over 300 years until the first limited improvements in lateral resolution were achieved by laser scanning confocal microscopy in the 1980s followed by more significant increases in axial resolution using interference coupled with standing wave illumination methodology in the late 1990s.
Continued development of advanced imaging techniques during the last decade has yielded a number of exciting developments that are collectively termed superresolution microscopy and feature both lateral and axial resolution measured in the tens of nanometers or even less, far surpassing the diffraction barrier, to enable the observation of structural details with unprecedented accuracy. These techniques are based on either probing the specimen with spatially modulated illumination or involve switching fluorophores on and off sequentially in time so that the signals can be recorded consecutively. Thus, for an implementation referred to as structured illumination microscopy (SIM), increased resolution is obtained by discarding traditional Köhler illumination and replacing it with non-uniform excitation light patterns that feature sinusoidal intensity variations in one or more dimensions coupled with powerful image reconstruction techniques. The other superresolution methods rely on spatially or temporally modulating the transition between two molecular states of a fluorophore (such as switching between a bright and dark state) or by optically reducing the size of the point-spread function used in the excitation illumination. Among the techniques that improve resolution by PSF modification are stimulated emission depletion (STED) and ground state depletion (GSD) microscopy. Alternatively, superresolution can also be achieved by temporally modulated precise localization of single molecules using photoactivated localization microscopy (PALM) and stochastic optical reconstruction microscopy (STORM). A large number of variations and improvements on these techniques continue to be reported.
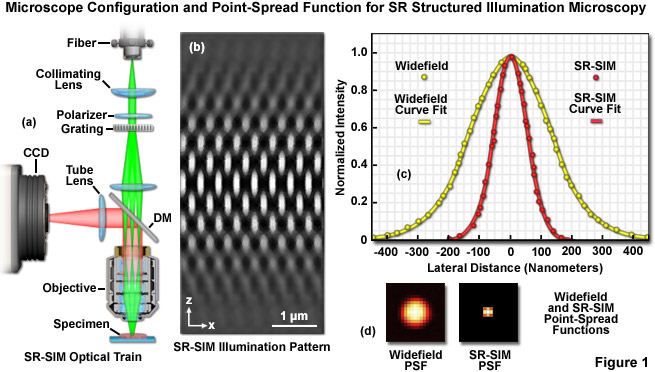
The optical configuration and point-spread function improvement for superresolution structured illumination microscopy (SR-SIM) are illustrated in Figure 1. The microscope configuration is presented in Figure 1(a) and consists of a laser source directed into the microscope optical train using a multimode fiber coupler. The laser light, which is scrambled before entering the microscope, is directed through a polarizer and a diffraction grating, and is then projected onto the specimen. Only the -1, 0, and +1 diffraction orders are focused onto the objective rear aperture, and these are collimated by the objective in the specimen focal plane where they interfere and generate a three-dimensional (lateral and axial) sinusoidal illumination pattern (Figure 1(b)). Fluorescence emission generated by illumination of the specimen is captured by a CCD camera system. The point-spread function for superresolution structured illumination is dramatically reduced (Figure 1(d)) compared to widefield fluorescence. As will be discussed below, the lateral resolution of SR-SIM approaches 100 nanometers or better, whereas the axial resolution is improved to approximately 300 nanometers.
back to top ^Historical Perspective
The potential application of structured illumination microscopy towards achieving sub-diffraction limit resolution was first described in 1963 by Walter Lukosz and Erich Marchand. These investigators explored the mathematical basis for introducing more "degrees of freedom" in the transmission of information. However, the first practical application of structured illumination did not occur until almost 30 years later in 1993 with the introduction of standing wave fluorescence microscopy (SWFM) by Brent Bailey and colleagues at Carnegie Mellon University. SWFM utilizes the interference of two non-focused counter-propagating laser beams from a pair of opposed objectives to create a standing wave pattern with an excitation intensity varying sharply along the optical axis. A standing wave pattern featuring planar nodes (dark) and anti-nodes (bright) results when the two beams coincide at a slight angle. The node period can be altered by adjusting the illumination angle of incidence. Molecules residing within an anti-node are selectively excited, allowing one to image very thin sections of a specimen. In theory, SWFM is capable of approximately 50-nanometer axial resolution but it is difficult to realize when imaging specimens thicker than the period of the illumination structure since multiple planes are excited simultaneously. The standing wave concept is a staple for many superresolution microscopies, including the majority of SIM techniques.
Roughly concurrent with the development of SWFM, 4Pi and InM emerged as analogous microscopy techniques that also use dual beam illumination from a pair of opposed objectives to sharpen the PSF in the axial dimension (see Figure 2). 4Pi is a laser confocal technique, developed by Stefan Hell and colleagues, where the constructive interference from two wavefronts focused at a common focal point results in an excitation PSF with a nearly isotropic (spherical) central maximum. However the PSF also features a pair of side lobe artifacts near the center along the optical axis. By allowing the coherent summation of emission light at the detector, a variation known as 4Pi Type C, one can achieve nearly 100-nanometer resolution in the lateral and axial dimensions. Additionally, the PSF side lobes can be reduced by using 4Pi in conjunction with two-photon excitation (2PE; Figure 2(b) and Figure 2(c)). Image Interference microscopy, denoted by the acronym InM, is the widefield analog of 4Pi developed by Mats Gustafsson and colleagues. With the simplest variation (I2M), the specimen is illuminated through a single objective and emission is observed through both objectives. The emission light paths are equivalent in length, resulting in constructive interference at the detector. I3M is a similar image interference technique that instead uses the interference of excitation light through both objectives to create an SWFM-type of axially varying structured illumination. I2M and I3M are independent techniques but, similar to 4Pi type C, they can be combined to increase axial resolution about 7-fold, an adaptation termed I5M. Both techniques perform well when imaging thicker specimens as compared to SWFM. The dual-objective interferometric approach would later be applied to other superresolution techniques, including to both SR-SIM and single molecule approaches.

In 1997 Tony Wilson and colleagues at Oxford University introduced a method for generating thin optical sections using a conventional widefield microscope and a relatively simple form of structured illumination, a technique known as optical sectioning structured illumination microscopy (OS-SIM). The fluorescence observed by a widefield microscope consists of not only that collected from the focal plane, but also from all parts of the specimen irradiated with excitation light. This out-of-focus fluorescence greatly reduces the apparent contrast between structures lying within the focal plane. However one can discriminate in-focus from out-of-focus information by projecting a grid pattern onto the specimen focal plane. Signal from in-focus information is modulated to a significantly higher degree than information lying outside of the focal plane. The grid pattern is focused onto the focal plane so that out-of-focus information does not undergo the same degree of frequency mixing (modulation) with the pattern as does information derived near the focal plane. This allows for computational discrimination of information originating in the focal plane from light that arises in areas removed from this location. The grid pattern has a sinusoidal intensity variation similar to the ones used by later SR-SIM implementations. An OS-SIM reconstruction requires one to acquire a set of images for each section, with the phase of the grid pattern shifted for each image in an optical section to ensure that all parts of the imaging area are observed. Axial optical sections can be made as small as 200 nanometers with a high numerical aperture (NA) objective and a fine grid spacing. Lateral resolution is left unaffected.
Most of the techniques discussed thus far are dependent upon illumination architectures that vary exclusively along the optical axis, allowing for the enhancement of axial resolution but leaving lateral resolution largely unaffected. Superresolution structured illumination microscopy was the first SIM technique to utilize transversely structured excitation illumination to sharpen lateral resolution. SR-SIM is actually a family of related structured illumination methodologies conceived around the same time, including laterally modulated excitation microscopy (LMEM; Rainer Heintzmann and Christoph Cremer), harmonic excitation light microscopy (HELM; Jan Frohn and colleagues), and SR-SIM as described by Gustafsson. All forms of SR-SIM are capable of improving lateral resolution to approximately 100 nanometers, with the primary difference between each variation being the illumination geometry. HELM uses a laser split into four coherent beams that are subsequently allowed to interfere in the specimen plane to create a mesh-type pattern of illumination that serves as the mask. Both of the other techniques use a laterally-modulated sinusoidal wave pattern of illumination that, for simplicity, will serve as the model discussed in the SR-SIM theoretical section below. In 2008, Gustafsson introduced a variation of his original SR-SIM setup that doubles axial resolution by a factor of 2 using a three-beam interference pattern featuring a non-trivial axial structure. The original two-beam pattern lacks structure along the optical axis. That same year, Gustafsson and colleagues also combined SR-SIM with I5M, utilizing the dual objective geometry and standing wave interference pattern to achieve three-dimensional 100-nanometer resolution, a technique dubbed I5S to denote the merger of SR-SIM with I5M. Similarly, Frohn and colleagues also proposed a dual objective version of HELM theoretically capable of 100-nanometer isotropic (laterally and axially equivalent) resolution.
In 2002, Heintzmann and colleagues introduced a theoretical scheme of resolution enhancement capitalizing upon the introduction of non-linear phenomena into a traditional SR-SIM system, a concept they termed saturated pattern excitation microscopy (SPEM). Non-linear effects make possible several superresolution microscopy techniques, including STED and GSD. The first practical implementation for structured illumination was published in 2005 when Gustafsson applied the concept to the imaging of fluorescent beads, extending the resolution of SR-SIM to approximately 50 nanometers. The resulting technique was termed saturated structured illumination microscopy (SSIM). By saturating the fluorescence emission in a specimen, one obtains a non-linear response to increasing excitation intensity, creating a high intensity "negative" of the specimen features and introducing the higher order harmonics into the signal necessary for extending resolution. Unfortunately, at saturating light intensities photobleaching becomes a serious issue for the vast majority of fluorophores. As a result, research into alternative methods for integrating non-linear illumination scenarios into SSIM is actively being conducted. Such alternative non-linear phenomenon includes the response of photoswitchable fluorescent probes to different types of illumination. SSIM has theoretically unlimited resolution, dependent only upon the number of detectable harmonics one can introduce into the obtained signal, as will be described below.
back to top ^Structured Illumination Microscopy for Optical Sectioning (OS-SIM)
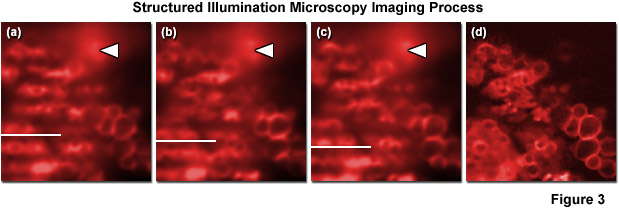
As described above, structured illumination microscopy is actually comprised of a family of related techniques that employ a combination of optical manipulations and computational algorithms to obtain optical sections and/or two-dimensional images featuring significantly improved resolution. In traditional structured illumination microscopy (OS-SIM), a pre-defined line pattern etched onto an optical-grade glass plate (referred to as a grid) is positioned in a conjugate focal plane and projected onto the specimen plane. Alternatively, a similar line-shaped illumination pattern can be generated by interference between two or more light sources (such as lasers). In the focal plane, the excitation intensity is modulated in a direction perpendicular to the long axis of the grid lines and the resulting fluorescence emission gathered from the specimen reproduces the pattern. However, for emission that arises in regions removed from the focal plane, the signal amplitude decreases according to the modulation transfer function such that the image of the grid pattern becomes increasingly blurred (reduced modulation) for photons that originate at progressively larger distances from focus. Due to the fact that fluorescence emission originating from structures outside the focal plane is far less modulated, the in-focus information can be easily discriminated from out-of-focus information simply by comparing several images where the pattern resides at different lateral positions. Fluorescence arising from structures that lie outside the focal plane will not vary in intensity between the successive images (see Figure 3) whereas emission from structures residing at the focal plane will feature a clear variation in their intensity patterns depending on the position of the modulated excitation pattern. Thus, an optical section can be calculated by comparing the intensities between images on a pixel-by-pixel basis.
The geometry of the pattern utilized in structured illumination can vary widely. For example, laser speckles provide a quasi-random pattern, while interference between two laser beams produces a well-defined pattern. Multi-point masks and metal-coated optical plates can also be used. The number of images required to reconstruct an optical section is dependent upon the width and spacing of the pattern lines. Sparse patterns (having large spacings with narrow lines) provide high modulation contrast but necessitate a higher number of images to unambiguously reconstruct an optical section. The most common pattern employs a Ronchi grating featuring a grid with a one-to-one line/space ratio, which requires a minimum of three images per plane in order to calculate an optical section. The application of Ronchi grating patterns in fluorescence microscopy to generate crisp optical sections was pioneered by Tony Wilson and colleagues, and has served as the foundation for several commercial implementations of the technique (including the ZEISS ApoTome and ApoTome.2). As presented in Figure 3, three raw images captured using an evenly spaced grid pattern at different positions verifies that fluorescence arising from outside the focal plane does not exhibit variations between the three images (Figure 3(a) through Figure 3(c)). In contrast, emission originating from structures within the focal plane varies dramatically with the grid position such that comparison of the emission intensity changes between the grid images (Figure 3(d)) enables removal of fluorescence during mathematical calculation of an optical section. Note the region of blurred high fluorescence intensity originating in a region removed from the focal plane that is indicated in Figure 3 by white arrowheads.
In cases where OS-SIM is conducted using non-coherent illumination light sources (such as a metal-halide or mercury arc-discharge lamp), the axial response of the grid projection can be approximated using the following equation:
FWHM(z) = (3.83/16π) · (λ x 10-3) / [(η·sin2(α/2)·νg·(1 - νg/2)] (1)
Where λ is the illumination wavelength in nanometers, η is the refractive index of the imaging medium, α is the aperture angle of the objective, and νg is the effective grid frequency in the specimen plane:
νg = (M · λ · ν) / (b · NA) (2)
In the grid frequency equation (Formula (2)), M is the objective magnification, ν is the grid frequency, b is an instrument-dependent magnification factor of the reflected light beam path, and NA is the objective numerical aperture. As a result, the thickness of an optical section generated by OS-SIM is determined by the grid frequency and the objective characteristics (magnification and numerical aperture). The optimal grid frequency for a given objective in OS-SIM is a compromise between signal-to-noise and the optical sectioning efficiency, similar to the case for a pinhole in confocal microscopy. In order to achieve optimal sectioning, different grid frequencies are needed for different objectives, as are now available in the ZEISS ApoTome.2. Moreover, the best signal-to-noise ratios are often found to be specimen-dependent (in effect, thick fluorescent tissue sections versus relatively thin adherent cells), so the ability to substitute different grids with a single objective can further optimize imaging parameters. Thus, for a 100x objective, various grid spacings can be used to modulate optical section thickness between approximately 0.2 and 1 micrometer. Listed in Table 1 are the grid spacings for the various interchangeable grids in the ZEISS ApoTome and ApoTome.2 optical sectioning units. These values can be used to compute the effective grid size for various microscopes (AxioImager: b = 1.3; AxioObserver: b = 2.57) and objectives.
ZEISS ApoTome and ApoTome.2 Grid Spacings
|
||||||||||||||||||||||||
Table 1
After gathering a set of three raw OS-SIM images, the final optical section image can be calculated using one of several algorithms. Perhaps the simplest approach is to use three images of equal phase shift (2/3π) applied on a pixel-by-pixel basis using the following equation:
IOS = [(I1 - I2)2 + (I1 - I3)2 + (I2 - I3)2]1/2 (3)
Provided the three raw images are captured with the exact same phase shift, the calculation in Formula (3) will result in an artifact-free image. Otherwise, inaccuracies in the grid movement will result in residual grid lines appearing in the final optical section. More advanced algorithms are capable of operating with arbitrary phase shifts. Additional artifacts, unrelated to the accuracy of grid translation in OS-SIM are caused by factors such as intensity fluctuations between the three raw images (for example, when photobleaching occurs or when the light source undergoes significant output variation). In multiply labeled specimens, different fluorophores often bleach at different rates, further complicating analysis. The use of rectangular instead of sinusoidal grating patterns (common in commercial instruments) can produce artifacts in the final images, but adding a parameter-optimization approach to the software algorithm can mitigate these problems.
Because many investigations in cell biology require quantitative data in terms of image intensity, the results of OS-SIM algorithms should be scrutinized to determine if they could be used in this manner. Many of the algorithms contain non-linear steps that may influence the linearity of the final intensity values. When fluorescence emission levels contain very high signal-to-noise, the effects of non-linear steps can be negligible, however, at low ratios, serious deviations from a linear relationship between the emitted fluorescence and the intensity of the sectioned image can occur. Therefore, it is advisable to avoid attempting quantitative analysis on OS-SIM optical sections acquired under low signal-to-noise conditions.
back to top ^Superresolution Structured Illumination Microscopy (SR-SIM)
Superresolution structured illumination microscopy is a powerful technique capable of doubling resolution in both the lateral and axial dimensions. However, SR-SIM is very complex and computationally intensive, requiring a strong foundation in the underlying math and physics to comprehend its theoretical basis and operation. This section will begin with an in-depth analysis of the diffraction limit and its implications before progressing towards a more substantial discussion of SR-SIM theory and analysis. As stated previously, the resolution of conventional widefield microscopy is limited to approximately 200 nanometers laterally and 500 nanometers axially due to the diffraction limit of light microscopy, as characterized by Abbe and Rayleigh. Although a fluorescent probe or molecule is in essence a point emitter (most have sub-nanometer dimensions) the observed fluorescence emission is blurred by diffraction, causing it to appear as a substantially larger focal spot whose dimensions govern the ultimate attainable resolution of the system. In optical microscopy, a point-emitter appears as a bright circular focal spot surrounded by concentric rings of decreasing intensity in two dimensions, a pattern referred to as an Airy Disk. In three dimensions the focal spot is referred to as the point-spread function (PSF) and appears as an ellipse stretched along the optical axis. The resolution of a microscope optical system is approximated by the equations:
Resolutionx,y = λ/2[η · sin(α)] (4)
Resolutionz = 2λ/[η · sin(α)]2 (5)
Formula (4) defines the lateral resolution, Formula (5) defines the axial resolution, λ is the average wavelength of the excitation illumination, η is the refractive index of the imaging medium, sin(α) is the aperture angle of the objective, and η · sin(α) is the numerical aperture (NA) of the objective. In an ideal system using an average excitation wavelength of 400 nanometers and an objective with a numerical aperture of 1.4, one can attain close to 150-nanometer lateral and 400-nanometer axial resolutions. However ideal systems do not exist and most probes are not excited by violet light, resulting in lower realized resolution. This limit also translates into reciprocal (frequency) space, where it is manifest in the form of an observable region. This observable region encompasses all frequencies for which the optical transfer function (OTF) of the microscope has a non-zero value and is thus commonly known as the OTF support. It should be noted that the OTF is the normalized Fourier transform of the point-spread function of the optical system, as shown in Figure 4, which illustrates the relationship between the actual fluorophore distribution (Ψ(x,y)), the PSF, and the OTF. The term FFT denotes the Fourier transform state of the data.
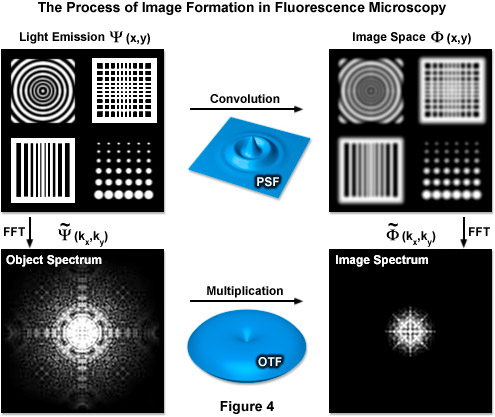
Figure 4 illustrates how convolution with the PSF acts as a low-pass filter with fine spatial details being lost while the OTF serves a similar function limiting the observable area of reciprocal space. The OTF support can be described as a circle in two dimensions and as a horn-torus in three dimensions. In simplest terms, all information residing within the OTF support is observable while all information positioned outside is not. The fundamental principle behind SR-SIM is to artificially move unobservable high-frequency information into the observable region through frequency mixing with a known illumination structure. The mixing results in the encoding of high frequency information in the form of lower (observable) frequency components.
The classical limit of resolution in the microscope also translates into frequency space, defining a maximum observable spatial frequency k0 given by:
k0 = 2NA / λem(6)
where k0 is the magnitude of the maximum observable spatial frequency, NA is the numerical aperture of the objective, and λem is the average observed emission wavelength. The circular region defining the OTF support has a radius of k0, and thus, high-frequency information residing outside of this area cannot be observed. The microscope in effect acts as a low pass filter, only allowing the observation of frequencies with a magnitude less than or equal to that of k0 as illustrated by Figure 5(b). Structured illumination of frequency k1 will result in a sum frequency k + k1 and a difference frequency k - k1 at each sample frequency of k and is visible in the form of moiré fringes (Figure 5(c)). Moiré fringes are a physical phenomenon resulting from the superposition of two fine patterns in a multiplicative fashion, in this case they are visible at the difference frequency k - k1 for each value k. This interaction is illustrated by Figure 5(a), which shows the overlay of two fine sinusoidal patterns, with the resulting near-vertical bars being the moiré fringes.
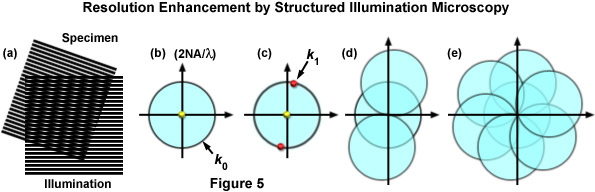
Figure 5 illustrates the general phenomenon of how moiré fringes are generated by two overlapping patterns of patterned lines (Figure 5(a)). The observable region of reciprocal space produced by a microscope objective (which is analogous to its diffraction pattern) is limited at the edges by the highest spatial frequencies that the objective can transmit (2NA / λ), where the central spot represents the zeroth order component. The zeroth (yellow dot) and first order (red dots) diffraction components representing a pattern of parallel lines are presented in Figure 5(c). If the pattern spacings lie at the limits of resolution, the first order spots occur at the edge of the observable field (shown here as red dots on the k0 boundary). Due to frequency mixing, the observable regions also contains, in addition to the normal image of spatial frequencies (center circle), two new offset frequency images (Figure 5(d)) that are centered on the edge of the original field. These offset images contain higher spatial frequencies that are not observed using traditional microscope optical systems. Finally, in Figure 5(e), a set of images is shown that were prepared from three phases at 120 degree orientations, which ultimately after processing, yield a real image that contains twice the spatial resolution as would be observed in widefield fluorescence microscopy.
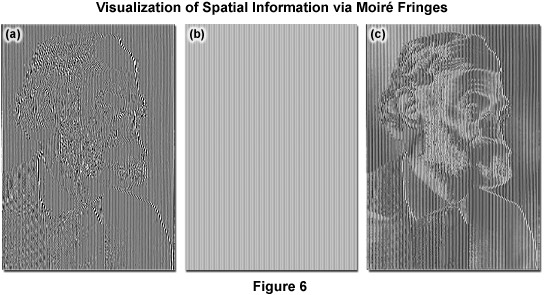
As described, Moiré fringes are the product of frequency mixing, and will be observable if the magnitude of the mixed frequency is less than or equal to that of k0 and thus lying within the observable region. This effectively increases the OTF support by creating an additional observable region with an origin at k1 and all information within radius k0 of k1 is accessible. Thus resolution is stretched from k0 to k1 + k0 and, because the magnitude of k1 cannot exceed that of k0, the ultimate theoretical resolution limit becomes 2k0. This translates into a doubling of conventional widefield resolution. In practice, the SIM grid is rotated through steps of 120 degrees to gather information across the lateral image plane (Figure 5(e)). The visualization of fine spatial information via moiré fringes is illustrated by Figure 6, where panel (a) consists of fine spatial details of a portrait of Ernst Abbe that, upon mixing with the linear structure from panel (b), results in lower frequency moiré fringes that make the portrait much easier to recognize, as seen in Figure 6(c).
Integral to SR-SIM theory and implementation is Fourier analysis of the raw data generated by the microscope in the rear focal plane of the objective. Fourier analysis was originally conceived by French mathematician Joseph Fourier as a method for simplifying the description of heat propagation. Since its inception, the method has become a widespread data analysis tool in almost every scientific and mathematical field, most notably physics and engineering. Specifically, the Fourier transform is the actual mathematical operation for approximating a given function as a sum of simpler constituent trigonometric functions, with the inverse operation also being possible. In theory, any structure can be duplicated as the sum of an unbound set of sinusoidal waves. In the context of its application to SR-SIM theory, this entails deconstructing observed fluorescence frequencies into their components, including the spatial frequency of the sinusoidal illumination structure, whose Fourier transform contains three components. Two of the three Fourier components are harmonic and interact independently with the frequency of the fluorophore density. The Fourier transform of a traditional uniform Köhler illumination structure has a trivial value lacking the harmonic components introduced by structured illumination and thus does not affect the apparent distribution of spatial details.
The observed fluorescent emission, E(r), of any given fluorescently labeled specimen is primarily determined by three factors, the local concentration of the fluorophore, D(r), multiplied by the local intensity of excitation illumination, I(r) , which in turn is convolved with the point-spread function of the optical system, PSF(r):
E(r) = [D(r) · I(r)] ⊗ PSF(r) (7)
where ⊗ denotes convolution, a mathematical operation on a pair of functions yielding a third function describing the area overlap as one function is translated with respect to the other. In the context of its application here, convolution with the PSF is, in effect, a Gaussian blur of the actual distribution density, approximating the consequence of the diffraction of light on point emitters. As in the case of deconvolution microscopy, it is best to obtain an experimental PSF measurement for image processing instead of using a theoretical model, especially if there is any type of aberration in the system. According to convolution theorem, the Fourier transform of a point-wise multiplication of two functions is equivalent to the convolution of the Fourier transforms of those functions, with the inverse holding true as well. Thus, taking the Fourier transform of each function yields the following expression:
Ẽ(k) = [D̃(k) ⊗ Ĩ(k)] · OTF(k) (8)
where tildes (~) denote the Fourier transform of a function and OTF(k) is the Fourier transform of PSF(r). Given that OTF(k) has a non-zero value, [D̃(k) ⊗ Ĩ(k)] will be observable. If uniform Köhler illumination is being employed, Ĩ(k) will have a trivial value and Ẽ(k) will depend directly upon the value of D̃(k) at some common point, k. However if Ĩ(k) has a non-trivial value, then the observed fluorescence frequency given by Ẽ(k) may depend non-locally upon the actual fluorophore distribution at some different point k. This convolution results in the potential for some observed spatial frequency Ẽ(k) at some observable point k to depend non-locally on fluorophore concentrations given by D̃(k) at distance d outside of the observable region. Information from outside of the observable region thus becomes available, albeit in an encoded form. In short, with structured illumination an observed signal of a given frequency can actually correspond to a higher (usually unobservable) spatial frequency. Thus Ĩ(k) must be a non-trivial function, ideally as finely structured as possible.
SR-SIM in its original form utilizes a sinusoidal pattern of parallel stripes given by the equation:
I(r) = I0[1 + cos(k0 · r + ϕ)] (9)
where ϕ specifies the phase of the illumination pattern. The effect of the sinusoidal illumination structure becomes apparent when comparing the Fourier transforms of images both without (Figure 7(a)) and with (Figure 7(b)) structured illumination. Displaced high frequency information becomes apparent due to moiré effects and is indicated by the arrowheads in Figure 7(b). The two dimensional Fourier transform of the illumination function consists of three delta function components that, when convolved with D̃(k) yields:
Ẽ(k) = I0[D̃(k) + 0.5D̃(k + k0)eiϕ + 0.5D̃(k - k0)e-iϕ] (10)
The observed emission light at each point in frequency space thus has three Fourier components corresponding to the three (yellow and red) points seen in Figure 5(c). If the periodicity of illumination structure is maximized, that is if the value of k0 is equivalent to the highest theoretical value calculated using Formula (6), then the center of each calculated transform will be located exactly along the outside edge of the original transform at a distance of magnitude k0 from the origin. In practice, this is accomplished by ensuring that the first diffraction order spots just enter the objective at opposite sides of the rear aperture. Acquiring a set of three images while adjusting the illumination phase for each yields three independent combinations of D̃(k), D̃(k + k0), and D̃(k - k0). The illumination phase translation increment should be equal to 1/3 of the grating period, which is required for proper separation of the three components summed in each image (Figure 7(c)). Three images thus result: the central normal image defined by D̃(k) and the two offset by D̃(k ± k0) that are separated by 180 degrees and are located on either side of the central transform. Since the illumination structure is known, the resulting 3 x 3 system of linear equations can then be solved algebraically to find the values of the constituent terms D̃(k), D̃(k + k0), and D̃(k - k0) in order to restore high frequency information to its correct place in frequency space (Figure 7(d)). However doing this only extends resolution in a single direction, as shown by Figure 5(d). In order to approximate an OTF support of radius 2k0 one must repeat this process using several different orientations of the grid pattern, as illustrated by Figure 5(e), to circumscribe the extended OTF support. The offset Fourier transforms obtained using 3 grid rotations is illustrated by Figure 7(c) and their computationally restored locations by Figure 7(d). Typically, one will use 3 orientations of the grid pattern to maximize acquisition speed or 5 orientations to increase the image quality of the superresolution reconstruction. The set of raw images corresponding to a single SIM reconstruction is referred to as a "SIM frame". When the specimen is illuminated by structured light generated by the grid pattern, moiré fringes will appear that represent information that has changed position in reciprocal space.
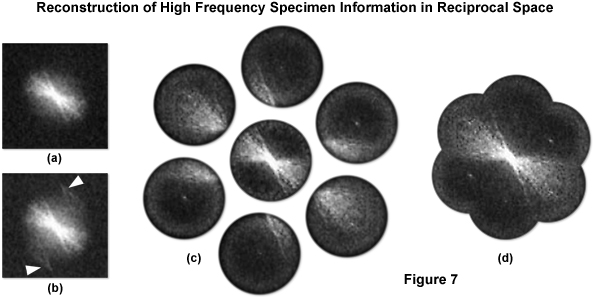
Figure 7 illustrates the generalized procedure for reconstructing high frequency information in reciprocal space as described in detail above. A typical Fourier transform of a microscope image with uniform illumination is presented in Figure 7(a) and with structured illumination in Figure 7(b). The arrows in Figure 7(b) denote high frequency information that has undergone frequency mixing with the illumination structure and as a result has been displaced into the observable region in the form of moiré fringes. Acquiring three images at different phases of the grid pattern for each of three azimuthal rotations of the grid allows for the computation of the 7 components displayed in Figure 7(c). Subsequent computational restoration of each component to its proper place results in an image transform (Figure 7(d)) with approximately twice the radius of the conventional image transform area as given by Figure 7(a), ultimately yielding a doubling of lateral resolution.
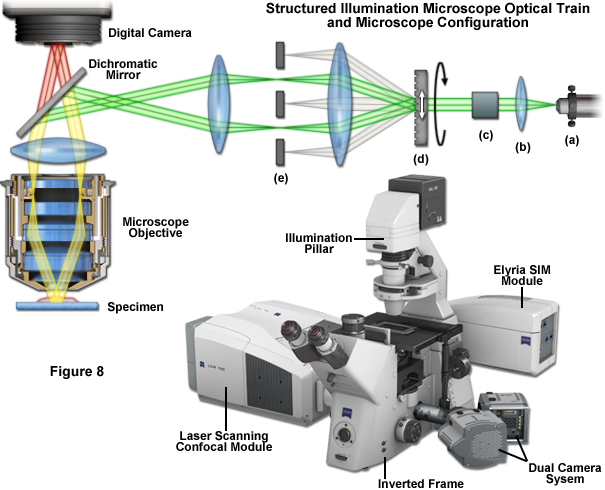
Fortunately SR-SIM instrumentation is not quite as complex as the underlying theory. Instrumentation is detailed schematically in Figure 1 and Figure 8. After delivery to the microscope via optical fiber (Figure 8(a)), the laser beam is collimated (Figure 8(b)) and linearly polarized (Figure 8(c)), at which point the actual spatial structure is generated by a phase grating (Figure 8(d)) that diffracts the beam into several orders. Of these orders, only the first (+1 and -1) are used, whereas the rest are removed using a beam block (Figure 8(e)). A more involved three-dimensional SR-SIM procedure involves also using the zeroth diffraction order, as will be discussed later. Approximately 80 percent of the light is diffracted into the first orders to produce a high-contrast sinusoidal pattern with a periodicity of approximately 200 nanometers, consistent with the diffraction limit of light microscopy and the resolution of the objective. The modulation depth of the stripe pattern projected onto the specimen should lie between 70 and 90 percent, and the grating is mounted on a rotatable, closed loop translation device.
Several grating sizes should be available for optimization with a given combination of excitation wavelength and objective. Some commercial instruments allow the choice of either three or five grid rotations (120 degrees or 72 degrees) to optimize either imaging speed or resolution, respectively. A sinusoidal phase grating is not the only available method for structuring the illumination intensity. Spatial light modulators (SLMs) bestow the advantage of moving the pattern 1000-times faster without moving the specimen or any optical component. Additionally, standing wave total internal reflection fluorescence microscopy (SW-TIRF; developed by Euiheon Chung of the Gwangju Institute of Science and Technology) can be used to selectively create interference patterns in the focal plane. After acquisition, the multiple sub-images for each grid orientation and phase are processed through a number of software steps to generate the final image. In optimized speed mode, a commercial SR-SIM instrument should be capable of live-cell imaging when targeting structures that lack significant motion, such as actin, mitotic chromosomes, focal adhesions, mitochondria, and the Golgi apparatus.
The most evident shortcoming of this original form of SR-SIM is the lack of significant improvement of axial resolution. Though the sinusoidal illumination structure described thus far works well structuring light and increasing resolution in the lateral dimensions, it lacks non-trivial axial structure, preventing the extension of the OTF support along the kz axis. However, in 2008 Gustafsson introduced a three-beam variation of SR-SIM with non-trivial axial structure capable of doubling resolution in that dimension. The third beam comes from unblocking the zeroth diffraction order. For technical reasons, the illumination structure must remain fixed with respect to the focal plane of the microscope rather than the specimen during acquisition of a z-stack.
This interference of the three beams in the focal plane results in an illumination structure with five Fourier components as opposed to the three afforded by the simpler two-beam interference pattern. Additionally two of those five components consist of two donuts apiece, displaced along the kz axis in such a manner that they fill in the missing cone of information from each of the three original Fourier components, as seen in Figure 9(h). By varying the phase and orientation of the illumination structure in the same manner as described for the two-dimensional version of this technique one can attain an OTF volume whose dimensions allow for the doubling of both lateral and axial resolution, as illustrated by Figure 9(j) and Figure 9(i). Acquisition of a z-stack combined with post-acquisition processing yields a superresolution reconstruction with approximately 100-nanometer lateral and 300-nanometer axial resolution.
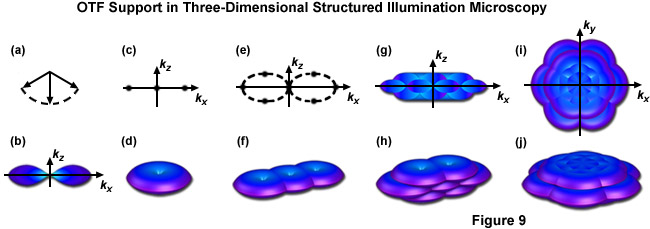
Figure 9 illustrates the expansion of the OTF support using the three dimensional variation of SR-SIM described above. Figure 9(b) shows the appearance of a conventional OTF volume (without structured illumination) as viewed along the ky axis, with Figure 9(d) showing that same volume (shaped as a torus) in three dimensions. Note in both Figure 9(b) and Figure 9(d) the lack of support about the kz axis approaching the origin, this missing cone of information seriously limits resolution in the z dimension. Figure 9(f) shows the expanded OTF support generated by a single grid rotation in a two-beam SR-SIM setup. Despite expanding lateral support as discussed earlier the missing cone problem is still present. One can decrease the periodicity of the illumination pattern, allowing the volumes to overlap enough to fill in the missing cones, but only at the cost of lateral resolution. Three-dimensional SR-SIM alleviates this problem by allowing the zeroth beam order, represented by the central vector in Figure 9(a) with the first diffraction orders to either side, to interfere. The resulting illumination pattern has three-dimensional structure, containing a pair of spatial frequency components located both above and below the kx - ky plane, as illustrated by Figure 9(e) where each spatial frequency component is represented by a dot. Traditional SR-SIM (as reviewed earlier) only has three spatial frequency components, as shown by Figure 9(c) and all are lying in a single dimension. Figure 9(h) is the three-dimensional OTF support volume described by Figure 9(e) and Figure 9(j) is the OTF support with 3 rotations of the grid pattern. A bird's eye view of Figure 9(j) is given by Figure 9(i) along with a view along the ky axis by Figure 9(g), where it can clearly be seen that the missing cone problem is no longer an issue. As a result both the lateral and axial resolutions are doubled, with axial resolution reaching approximately 300 nanometers.
To this point SR-SIM imaging has only been described for a single color. As a result, parameters such as excitation wavelength and grating periodicity have been treated as static values. The fundamental problem with multicolor SR-SIM imaging is that the optimal parameters used for imaging with a specific wavelength will not be the same as those for a different wavelength. Perhaps most important, the periodicity of the illumination structure must be altered for different emission wavelengths (remember that the value k0 is dependent on wavelength and cannot exceed the value approximated using Formula (6)). Several methods have been developed for solving this dilemma; Mats Gustafsson and colleagues implemented a set of lenses and mirrors on a modular structure termed a zoom plate to appropriately focus the diffracted beam orders onto the objective rear aperture to ensure maximum periodicity of the illumination structure for any given wavelength. With this setup, they successfully performed three-color three-dimensional SR-SIM imaging of the nuclear periphery in fixed adherent cells. In their work they noted that it would also be feasible to have preset exchangeable gratings for different magnification and wavelength combinations. More recently, the same group used a spatial light modulator for fine control of the grid pattern without any mechanical motion, demonstrating 8.5-second temporal resolution for two colors in three dimensions with live cells.
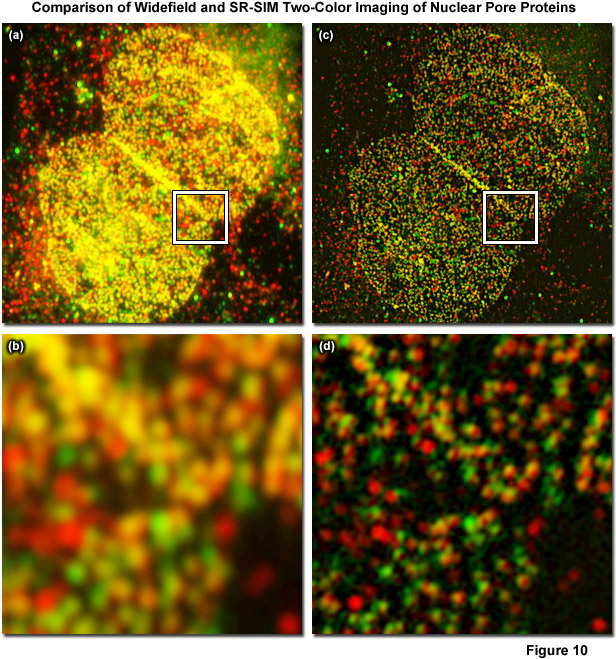
Figure 10 displays a two-color immunofluorescence SR-SIM reconstruction of the distribution of two different nuclear pore proteins in the nucleus of a human osteosarcoma (U2-OS line) adherent tissue culture cell. Figure 10(a) shows a low magnification widefield fluorescence image of the nucleus, whereas Figure 10(b) is a zoomed area circumscribed by the white box in Figure 10(a). The corresponding SR-SIM image is depicted in Figure 10(c) with a zoomed area in Figure 10(d). Cells were fixed with 2 percent paraformaldehyde, permeabilized with 0.2 percent Triton X-100, and non-specific staining was blocked with a 10 percent solution of normal goat serum. The nucleoporin, Nup-214, was detected using a rabbit anti-Nup-214 primary antibody coupled to an Alexa Fluor 568-labeled secondary. Nup-62 was detected using a mouse anti-Nup-62 primary antibody coupled to an Alexa Fluor 488-labeled secondary. SR-SIM data was acquired using a ZEISS Elyra inverted research microscope with the PS.1 superresolution module and analyzed using the ZEISS Zen 2010D software. Imaging was performed sequentially, with Nup-214/Alexa Fluor 568 being imaged first, using 5 rotations of the grid pattern and 3 phases for each rotation. Following acquisition, the data was analyzed using the SIM module in the Zen 2010D software, using automatically calculated noise filter values and a theoretical PSF model. Resolution of about 110 nanometers and 130 nanometers was obtained for Nup-62 and Nup-214, respectively. Colocalization analysis of the inset region for the widefield image yielded a Pearson's correlation coefficient (PCC) of 0.76. Interestingly, an analysis of the same area within the SIM reconstruction yielded a PCC of 0.48. The PCC of the SR-SIM image is significantly lower, illustrating how uncertainty due to the diffraction of light can seriously affect quantitative measures of molecule interaction.
There are still additional considerations that must be taken into account moving into the multi-color regime. Using Gustafsson's SR-SIM optical configuration, up to four wavelengths can be recorded simultaneously using a set of four dichroic mirrors to direct light to one of four independently controlled electron-multiplying charge-coupled device (EMCCD) cameras. More commonly though, data is acquired sequentially, imaging the entire volume with one wavelength before changing the imaging conditions (grid spacing, filters, etc.) and proceeding to the next. The sequential imaging scheme using pre-sized exchangeable gratings is the current method of choice for commercial SR-SIM implementations, such as the ZEISS Elyra.
back to top ^Saturated Structured Illumination Microscopy (SSIM)
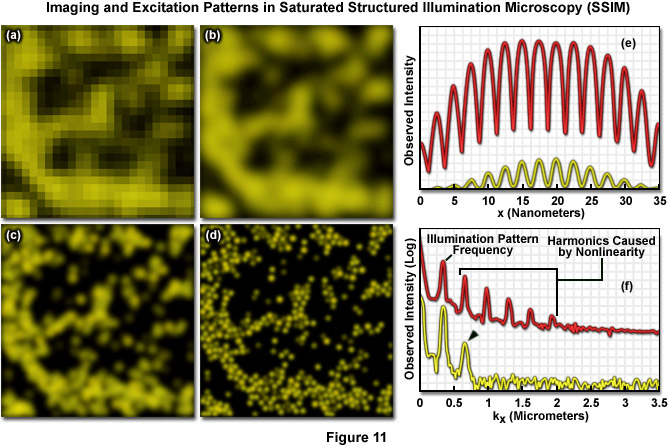
Both SSIM and SPEM make use of the RESOLFT (Reversible Saturable Optical Fluorescence Transitions) concept fundamental to other superresolution microscopies, such as STED and GSD. A RESOLFT scheme requires a fluorescent probe capable of switching between any two distinct states A and B (such as a dark and a bright species). With STED microscopy the excited S1 state is depleted within a donut-shaped focal volume, thus saturating the ground S0 state. The donut shaped light intensity is used to stimulate emission of all fluorophores within the area, however a small central zero node is left unaffected where normal excitation illumination can reach the specimen. This results in sub-diffraction limited excitation intensity at the zero node where fluorescence can be observed. GSD is similar in concept but relies upon the dark triplet state instead of the ground state. SSIM is an inverse application of this approach; fluorescence is saturated so that ideally all fluorophores reside in the excited S1 state, saturating it instead of the S0 ground state. The result appears as a "negative" image of the structural details featuring highly defined dark and fluorescent regions. Thus instead of being able to observe a more gradual sinusoidal pattern of illumination, as described by Formula (9) and seen in the focal plane using traditional SR-SIM implementations, the pattern appears as a type of square wave (Figure 11(e)) where fluorescence intensity rises and drops in a drastic non-sinusoidal fashion about the nodes. SSIM and SPEM use this inverse approach to RESOLFT within the superresolution framework defined by SR-SIM to substantially sharpen lateral resolution. A resolution of 50 nanometers using fluorescent beads was reported with the introduction of SSIM, as shown by Figure 11. Figure 11(a) depicts a normal widefield image of a field of fluorescent beads, whereas Figure 11(b) shows that same widefield image following deconvolution analysis, and Figure 11(c) depicts even better resolution of the area using SR-SIM. Finally, 50-nanometer resolution is shown using SSIM in Figure 11(d). It should be noted that the SSIM technique has theoretically unlimited resolution.
As previously noted, linear SR-SIM techniques are capable of producing a two-fold increase in resolution along all axes as compared to traditional widefield fluorescence microscopy. SSIM and SPEM introduce non-linearity into the observed signal to make additional resolution extension possible through post-acquisition processing. Superresolution structured illumination introduces a single harmonic, which results in an additional pair of Fourier frequency components for each orientation of the grid pattern. However by incorporating non-linearity into the observed signal, additional higher order harmonics become apparent in frequency space and can subsequently be used to expand the OTF support and increase the resolution of the system. There is not a technical limit to the number of higher order harmonics that can be observed, but limitations such as the signal-to-noise ratio and photobleaching rates of fluorophores define what is practical. The original implementation of SSIM utilized 3 harmonic orders in addition to those created by structured illumination, resulting in approximately 50-nanometer resolution – (a two-fold increase over SR-SIM). Other than instrument complexity, the foremost complication inherent in SSIM imaging is photobleaching. Very few probes are capable of providing uniform fluorescence under saturating conditions (generally entailing very high laser powers) for any lengthy period of time. Furthermore, the more harmonic orders one uses to create a reconstruction, the more constituent images that are inherently required, as illustrated by Figure 12(e). Three grid pattern orientations are the established minimum for SR-SIM. However, if one were to use four total harmonic orders and only three orientations, there would be large gaps of missing information towards the periphery of the OTF. As a result, more grid orientations are required to fill in the missing information, and 12 rotations were used by Gustafsson when imaging with four total harmonic orders and 50-nanometer resolution. Additionally, each rotation still requires three images at different phases, resulting in a total of 36 constituent images per single two-dimensional SSIM reconstruction. In order to help limit photobleaching, one can use short, intense laser pulses (on the order of nanoseconds or less) with a duration similar to the fluorescence lifetime profile of the chosen probe. For this reason, researchers are exploring alternative methodologies for introducing non-linearity into the signal.
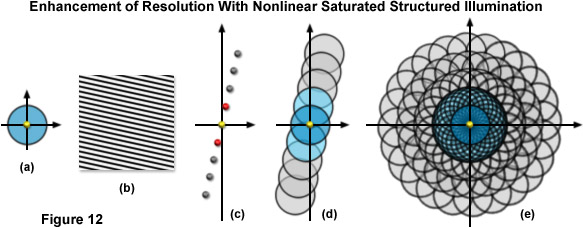
Figure 12 illustrates the expansion of the observable region using SSIM with 3 additional harmonics. The conventional OTF support is shown by Figure 12(a) along with a sample sinusoidal structured illumination intensity in Figure 12(b). Figure 12(c) shows the spatial frequency components (represented as yellow, red, and gray dots) for a single grating rotation in a SSIM implementation using 3 additional higher order harmonics. The yellow dot at the origin is the single component obtained using traditional non-structured microscopy, the set of red dots to either side are frequency components obtained using linear SR-SIM, whereas the 3 sets of gray dots outside of those correspond to the higher order harmonics obtained using SSIM. Figure 12(d) shows the total OTF support area for the spatial frequency components illustrated by Figure 12(c), while Figure 12(e) shows the total support for SSIM using 3 harmonics in conjunction with 12 rotations of the grid pattern. The observable region circumscribed in Figure 12(e) has twice the radius of that obtainable using linear SR-SIM and quadruple that of traditional non-structured fluorescence microscopy, translating into a lateral resolution of approximately 50 nanometers.
SSIM relies upon the same two-beam illumination structure employed by the original two-beam version of SR-SIM, which has a maximum resolution of approximately 2k0 or twice the conventional resolution defined by the diffraction barrier for optical microcopy. However if fluorescent emission depends non-linearly on the excitation intensity, then one effectively introduces higher order harmonics into the illumination structure containing spatial frequencies that are multiples of k1. A non-linearity that can be described by a non-polynomial term (one having an infinite Taylor Series) gives rise to theoretically unlimited resolution. Non-linearity that can be described by a polynomial can yield (s - 1) harmonics, where s is the order of the polynomial expression. In practical terms resolution is limited by photobleaching, signal-to-noise, and other such difficulties that inherently arise with a real-world microscope configuration.
As previously stated, a RESOLFT technique such as STED depends upon saturation of the dark ground state (S0) of a fluorophore population while SSIM, using an inverse approach, uses saturation of the excited state, S1. Following absorption of a photon, a given fluorophore will remain in the excited S1 state for an average time τ (a value known as the fluorescence lifetime) before emitting a photon and consequently returning to the electronic ground state. Therefore, a molecule cannot (in general) absorb more than one photon per lifetime τ, resulting in a non-linear response to excitation intensities exceeding the threshold value. If a specimen is excited with a sinusoidal light structure at or exceeding the saturation intensity, the observed fluorescence will have a non-sinusoidal shape containing a new series of harmonics with higher spatial frequencies than the actual illumination pattern. The emission structure will appear more so as a square wave as described earlier than a sine wave. Approximation of this structure requires the addition of a technically infinite amount of additional higher order harmonics to the original sinusoidal waveform.
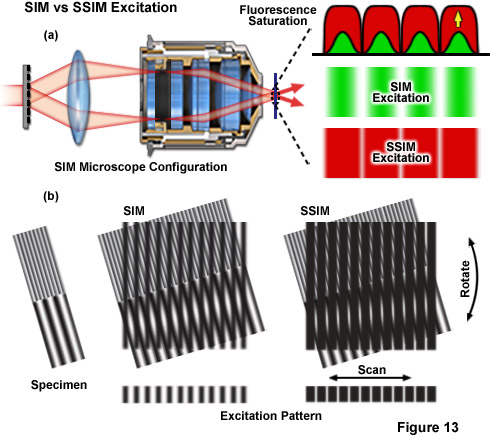
Figure 13 depicts the differences between the effective excitation pattern of a linear SR-SIM system versus that of a SSIM system. Both techniques rely upon the diffraction of light into several orders of which a subset are allowed to interfere in the focal plane to form the illumination structure (Figure 13(a)). The conventional SR-SIM illumination structure has a true sinusoidal shape with gradual uniform intensity variations between each node and anti-node (green patterns in Figure 13(a)). Though SSIM can use the exact same diffraction grating and illumination structure, fluorescence saturation causes the structure to effectively lose its sinusoidal shape, instead appearing as a square wave with sharply varying intensities between each node and anti-node (red patterns in Figure 13(a)). The result is that a technically infinite number of additional higher order harmonics are required to describe the illumination structure. The difference between excitation with SR-SIM compared to SSIM is illustrated by Figure 13(b) where it is apparent that much finer moiré fringes are created using SSIM.
SSIM instrumentation is largely similar to that used for Gustafsson's original two-beam SR-SIM apparatus. Structured illumination is produced by two powerful interfering light beams split from a single laser that form a standing wave grid pattern projected across only the lateral dimensions of the specimen. Interference of the first diffraction orders (+1 and -1) is used to create the sinusoidal stripe pattern of illumination. The zeroth order from the laser source is blocked with a beam stop. Most of the fluorescent probes within the specimen saturate due to exposure of the intense illumination, leaving only narrow dark line-shaped volumes (zero nodes) having a period of approximately 200 nanometers (the maximum periodicity possible due to the diffraction limit) at the edges of the interference pattern. As the excitation energy is increased, the walls surrounding the nodes become much larger. This methodology is implemented on widefield, non-scanning microscopes by phase-shifting the pattern to render otherwise unresolvable superresolution information visible in the form of harmonic frequencies and fundamental moiré fringes. Due to the fact that resolution is only improved in the direction perpendicular to the line-shaped zero nodes, the pattern must be shifted in several directions to cover a large number of angles in the focal plane.
As discussed previously, research into alternative methods for introducing non-linearity into the signal is being conducted. The strong excitation intensities required for SSIM imaging precludes the use of most commonly available fluorophores. The best remedy for this dilemma is to remove the necessity for strong intensities by implementing molecular transitions that occur predictably and with lower laser powers. Many bistable fluorescent probes fulfill this criterion and are able to be optically switched between fluorescent and non-fluorescent states through low-energy mechanisms such as photo-induced cis-trans isomerization. The use of photoswitchable probes is especially exciting because it entails the possibility of combining this powerful technique with the use of a growing library of genetically encoded fluorescent proteins, which are routinely used to image a large number of cellular structures in vivo. Continued development of SSIM promises to be exciting, with potentially unlimited resolution and as yet unrealized potential for three-dimensional imaging with exceptional axial resolution.
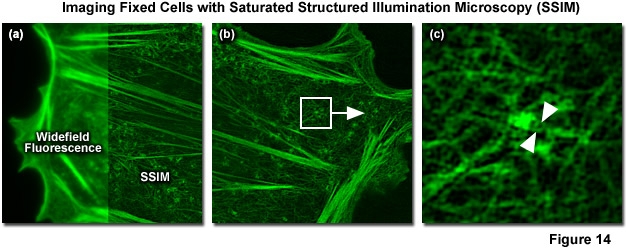
In 2012 Mats Gustafsson and Hesper Rego reported SSIM imaging of fixed adherent cells using the photoswitchable fluorescent protein Dronpa. 40-nanometer resolution was reported for purified microtubules (Figure 14) and 60-nanometer resolution for nuclear pores and the actin cytoskeleton in mammalian cells. Blue light (as provided by a 488-nanometer laser) is used to both excite fluorescence from Dronpa and to drive it back towards a dark state, requiring subsequent re-activation with violet (405 nanometers) light to return Dronpa to the fluorescent state. This photoswitching process results in a nonlinear relationship between excitation and fluorescence intensity. Though both the “on” and “off” states of Dronpa can be saturated, the off was chosen for technical reasons. Using the traditional SR-SIM sinusoidal illumination structure, the off state was saturated using 488-nanometer light, allowing only Dronpa molecules located at intensity minima to fluoresce. Increasing saturation levels result in narrower excitation minima within which fluorescence is possible, similar to the highly defined minima created by saturation of the fluorescent state in the original version of SSIM. Increasing the ratio of the exposure time to the characteristic fluorescent off-time of Dronpa results in more higher-order harmonics becoming accessible for data analysis. A Chinese hamster ovary cell (CHO line) expressing Dronpa fused to Lifeact, a short peptide targeting the filamenous actin network, is illustrated in Figure 14(a) in both widefield fluorescence illumination (left panel) and non-linear SSIM (right panel). Fine details of the network are clearly visible in the SSIM image, but are blurred in the widefield image. A small portion of the SSIM image (white box in Figure 14(b)) is enlarged to show clearly resolved filaments (Figure 14(c)) that are blurred using either conventional widefield or SR-SIM imaging systems.
back to top ^Conclusions
Superresolution microscopy is a burgeoning new field that is constantly challenging the limits of what optical microscopy has been shown to be capable of producing. For hundreds of years the diffraction barrier of optical microscopy has been a constant, sharply limiting the resolution obtained when imaging specimens using visible light. However the diffraction barrier is now becoming an increasingly outdated concept, with new developments and implementations of novel superresolution techniques constantly being introduced to this rapidly maturing field. More progress has been made towards increasing resolution in light microscopy over the past 30 years than the previous 300. Optical methods are now pushing into a realm previously occupied solely by electron microscopy, approaching single nanometer resolution and potentially farther with continuing developments. A multitude of different approaches have been explored over the past couple decades, with each technique spawning a slew of helpful variations and highly creative acronyms. Perhaps the two most notable families of these techniques are single molecule microscopy, including PALM, STORM, and their respective variants, as well as the structured illumination microscopy SIM techniques explored here.
Of the now numerous available superresolution methods, those belonging to the structured illumination microscopy family stand out as quite possibly the most versatile. Of these the OS-SIM methodologies are arguably the easiest and most cost-efficient to implement, with commercial availability as a simple attachment for a standard upright widefield fluorescence microscope. OS-SIM does not have the resolution-enhancing prowess as other SIM techniques, but it offers a cheap and arguably superior alternative to confocal imaging, especially in three dimensions. SR-SIM strikes a unique balance between resolution, ease of use, and speed. SR-SIM acquisition times are impressively short, especially in comparison to single molecule methods such as PALM and STORM that often require hours of continuous imaging to create a single reconstruction. Two-dimensional images take only seconds to acquire, making time-lapse imaging and real-time processing possible.
Additionally, both OS-SIM and SR-SIM can be used in conjunction with almost any fluorescent probe, as opposed to being forced towards expensive probes from a specialized, limited pool. This is especially important for the researcher who cannot afford to repeat entire experiments simply because they need to use a different fluorophore. Commercial implementations of SR-SIM and OS-SIM are now widely available, as exemplified by the ZEISS Elyra and Apotome.2, respectively. Commercial development and availability will likely continue and help standardize the use of these techniques, especially in terms of what is necessary for publication. SSIM has the potential to match single molecule superresolution microscopies in terms of resolution, with 50-nanometer lateral resolution having already been achieved and having no theoretical limit to potential resolution. New developments are constantly pushing the envelope of what SIM is capable of, all while established SIM methodologies are becoming increasingly accessible to researchers for use in lieu of traditional fluorescence microscopy techniques. Perhaps the only thing more exciting than what SIM techniques already have to offer is what the future holds for their continued development.
Contributing Authors
Mats G. L. Gustafsson - Howard Hughes Medical Institute, Janelia Farm Research Campus, Ashburn, Virginia, 20147.
John R. Allen and Michael W. Davidson - National High Magnetic Field Laboratory, 1800 East Paul Dirac Dr., The Florida State University, Tallahassee, Florida, 32310.