


Aperture correlation microscopy combines the light efficiency of structured illumination with the acquisition speed of a spinning disk confocal instrument. The technique promises to push SIM into new applications where high temporal resolution is mission-critical, while simultaneously maintaining the relatively simple instrumentation (especially the use of a white light source) of other SIM instruments. A necessary step for increasing the speed of SIM image acquisition involves abandoning offline demodulation techniques. Instead, demodulation must be conducted not only by illuminating the sample through a structured mask, but also by employing the same mask for detection in order to directly identify emission from the focal plane. The goal of aperture correlation microscopy is to overcome the limited light efficiency of traditional spinning disk systems where a multi-pinhole array is used to sweep across the specimen and probe the sample at several points in parallel.
The tutorial initializes with a blank specimen image window and the Acquire Image button activated. In order to operate the tutorial click on the Acquire Image button to simulate gathering of an image with the ZEISS VivaTome using both transmitted and reflected light from the spinning disk. Next, click on the Extract & Mirror button to initiate image processing. Finally, click on the Process Image button to generate an optically sectioned image (Subtraction radio button). Examine the resulting widefield image by clicking on the Addition radio button.
In aperture correlation microscopy, the final image is calculated in three steps: first, the two images have to be extracted from the side-by-side view and one image is mirrored to match the image orientations. The second step involves a registration of both images to ensure that the overlay is precise on a pixel-by-pixel basis. In the registration step, distortions as mapped in a previous calibration step are corrected between the two imaging beam paths. The third step is the actual calculation of the optical section itself. A scaled subtraction of both images will yield the optical section. Conversely, a scaled addition of both intensities results in a normal widefield image, as all intensities from the sample are then combined in one image. The scaling factor (k) is used to correct for small differences in transmission efficiencies in the two imaging beam paths:
IOptical Section = ITransmitted - k • IReflected (1)
IWidefield = ITransmitted + k • IReflected (2)
In equations (1) and (2), the term on the left-hand side (IOptical Section or IWidefield) denotes the pixel intensity in the final image, whereas the ITransmitted and IReflected terms represent the pixel intensity in the image resulting from light transmitted through the disk or reflected from the surface of the disk, respectively. As discussed, the term k is a scaling factor designed to correct for transmission differences in the separate optical pathways of the transmitted and reflected light. It is noteworthy that although the final image is calculated, the entire calculation is strictly linear in respect to pixel intensity and, therefore, the intensity in the final section image can be directly correlated to the original intensity. As a result using aperture correlation microscopy images for quantitative intensity analysis is straightforward.
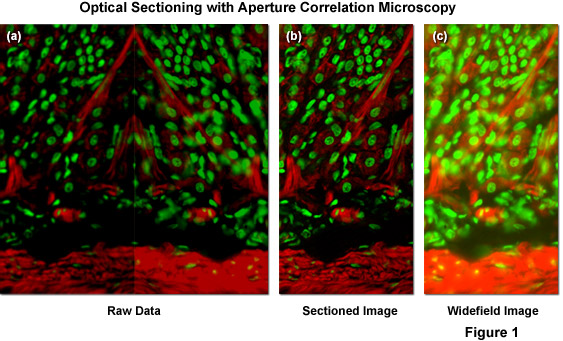
Illustrated in Figure 1(a) is typical raw image data generated by a ZEISS VivaTome aperture correlation microscope, as well as images representing the calculation of an optical section using equation (1) and (2) above. The specimen is a thick (16 micrometers) cryosection of rat stomach (fundus region) stained with Alexa Fluor 568 conjugated to phalloidin to highlight filamentous actin and counterstained with SYTOX Green to label nuclei. Within the raw image data, both the fluorescence detected passing through the disk (containing a conjugate image containing both widefield plus in-focus information; right side of Figure 1(a)), and fluorescence rejected at the disk (a non-conjugate image containing widefield data minus the in-focus information; left side of Figure 1(a)) are contained. During post-acquisition image processing both images are extracted, one half is mirrored, and both images are registered to account for differences in the imaging paths. A scaled subtraction results in an optically sectioned image (Figure 1(b)), whereas a scaled addition results in a conventional widefield image (Figure 1(c)). Thus, a scaled subtraction of the two image halves results in one image containing only the confocal information and a scaled addition of both image halves adds all the intensity from the specimen to produce a normal widefield image.
Contributing Authors
Tony B. Gines and Michael W. Davidson - National High Magnetic Field Laboratory, 1800 East Paul Dirac Dr., The Florida State University, Tallahassee, Florida, 32310.