


Introduction
Fluorescence is a member of the ubiquitous luminescence family of processes in which susceptible molecules emit light from electronically excited states created by either a physical (for example, absorption of light), mechanical (friction), or chemical mechanism. Generation of luminescence through excitation of a molecule by ultraviolet or visible light photons is a phenomenon termed photoluminescence, which is formally divided into two categories, fluorescence and phosphorescence, depending upon the electronic configuration of the excited state and the emission pathway. Fluorescence is the property of some atoms and molecules to absorb light at a particular wavelength and to subsequently emit light of longer wavelength after a brief interval, termed the fluorescence lifetime. The process of phosphorescence occurs in a manner similar to fluorescence, but with a much longer excited state lifetime.
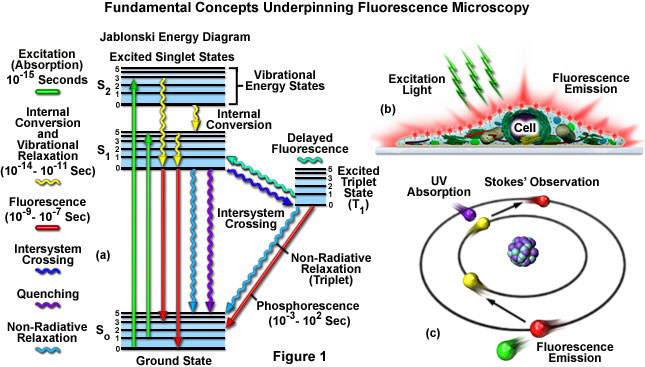
The fluorescence process is governed by three important events, all of which occur on timescales that are separated by several orders of magnitude (see Figure 1(a)). Excitation of a susceptible molecule by an incoming photon happens in femtoseconds (1015 seconds), while vibrational relaxation of excited state electrons to the lowest energy level is much slower and can be measured in picoseconds (1012 seconds). The final process, emission of a longer wavelength photon and return of the molecule to the ground state, occurs in the relatively long time period of nanoseconds (109 seconds). Although the entire molecular fluorescence lifetime, from excitation to emission, is measured in only billionths of a second, the phenomenon is a stunning manifestation of the interaction between light and matter that forms the basis for the expansive fields of steady state and time-resolved fluorescence spectroscopy and microscopy. Because of the tremendously sensitive emission profiles, spatial resolution, and high specificity of fluorescence investigations, the technique has become an important tool (cartoon in Figure 1(b)) in genetics and cell biology.
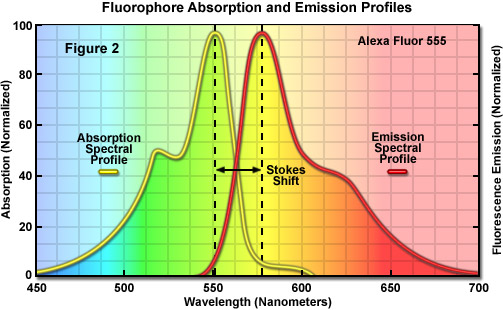
Several investigators reported luminescence phenomena during the seventeenth and eighteenth centuries, but it was British scientist Sir George G. Stokes who first described fluorescence in 1852 and was responsible for coining the term in honor of the blue-white fluorescent mineral fluorite (fluorspar). Stokes also discovered the wavelength shift to longer values in emission spectra that bears his name (known as the Stokes Shift; Figure 1(c) and Figure 2). Fluorescence was first encountered in optical microscopy during the early part of the twentieth century by several notable scientists, including August Köhler and Carl Reichert, who initially reported that fluorescence was a nuisance in ultraviolet microscopy. The first fluorescence microscopes were developed between 1911 and 1913 by German physicists Otto Heimstaedt and Heinrich Lehmann as a spin-off from the ultraviolet instrument. These microscopes were employed to observe autofluorescence in bacteria, animal, and plant tissues. Shortly thereafter, Stanislav Von Provazek launched a new era when he used fluorescence microscopy to study dye binding in fixed tissues and living cells. However, it wasn't until the early 1940s that Albert Coons developed a technique for labeling antibodies with fluorescent dyes, thus giving birth to the field of immunofluorescence. By the turn of the twenty-first century, the field of fluorescence microscopy was responsible for a revolution in cell biology, coupling the power of live cell imaging to highly specific multiple labeling of individual organelles and macromolecular complexes with synthetic and genetically encoded fluorescent probes.
In contrast to other modes of optical microscopy that are based on macroscopic specimen features, such as phase gradients, light absorption, and birefringence, fluorescence microscopy is capable of imaging the distribution of a single molecular species based solely on the properties of fluorescence emission. Thus, using fluorescence microscopy, the precise location of intracellular components labeled with specific fluorophores can be monitored, as well as their associated diffusion coefficients, transport characteristics, and interactions with other biomolecules. In addition, the dramatic response in fluorescence to localized environmental variables enables the investigation of pH, viscosity, refractive index, ionic concentrations, membrane potential, and solvent polarity in living cells and tissues.
back to top ^Fluorescence Microscope Filter Configuration
The essential feature of any fluorescence microscope is to provide a mechanism for excitation of the specimen with selectively filtered illumination followed by isolation of the much weaker fluorescence emission using a second filter to enable image formation on a dark background with maximum sensitivity. Localized probe concentration in biological specimens is so low in many experiments that only a small fraction of the excitation light is absorbed by the fluorescent species. Furthermore, of those fluorophores that are able to absorb a quantity of illumination, the percentage that will emit secondary fluorescence is even lower. The resulting fluorescence emission brightness level will range between three and six orders of magnitude less than that of the illumination. Thus, the fundamental problem in fluorescence microscopy is to produce high-efficiency illumination of the specimen, while simultaneously capturing weak fluorescence emission that is effectively separated from the much more intense illumination band. These conditions are satisfied in modern fluorescence instruments by a combination of filters that coordinate excitation and emission requirements based on the action and properties of the dichromatic beamsplitter.
Spectral Colors versus Wavelength Band
|
||||||||||||||||||||||
Table 1
Fluorescence molecules can only absorb light of a limited wavelength range dictated by the nature and extent of the delocalized electrons, spanning from approximately 20 to 100 nanometers (as illustrated in the yellow spectrum in Figure 2). In describing fluorescent molecules, the term fluorochrome refers to a molecule that exhibits fluorescence, whereas fluorophore is used to identify a fluorochrome that is attached to a binding partner that enables it to target a specific biological entity. Three fundamental parameters commonly used in describing and comparing fluorophores are the molar extinction coefficient (ε), quantum yield (Φ), and the fluorescence lifetime (τ). Molar extinction coefficients are widely employed in the fields of spectroscopy, microscopy, and fluorescence in order to convert units of absorbance into units of molar concentration for a variety of chemical substances. The extinction coefficient is determined by measuring the absorbance at a reference wavelength (characteristic of the absorbing molecule) for a one molar (M) concentration (one mole per liter) of the target chemical in a cuvette having a one-centimeter path length. The reference wavelength is usually the wavelength of maximum absorption in the ultraviolet or visible portions of the light spectrum. Each of the various fluorochromes or fluorophores exhibits its own specific absorption and emission spectrum (Figure 2), depending on the internal structure of the fluorescence molecules and sometimes also on their environmental surroundings. Furthermore, not every photon is efficiently absorbed and re-emitted as longer wavelength radiation (spectral colors versus the perceived color are listed in Table 1). The percentage of photons emitted versus the number absorbed is a constant for every fluorophore known as the quantum yield. Finally, the amount of time that a fluorophore spends in the excited state without emitting a photon is known as the fluorescence lifetime.
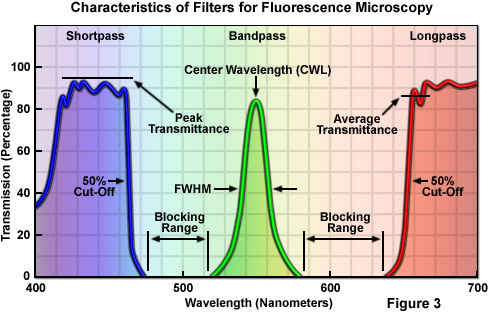
In general, filters can be categorized according to terms used in the description of filter action and wavelength transmission or absorption profiles. There are two basic classes of filters that regulate transmission of specific wavelengths. Bandpass filters (Figure 3) transmit a band of wavelengths and block all light above and below the specified transmission range. These filters are characterized with respect to optical performance by their center wavelength (CWL) and bandwidth, also referred to as the full width at half of maximum transmission (FWHM). Edge filters are also commonly referred to as longpass and shortpass filters, and are cataloged according to their cut-on or cut-off wavelengths at 50 percent of peak transmission (see Figure 3). Longpass filters transmit long wavelengths and block short wavelengths, while shortpass filters have the opposite properties of passing or transmitting short wavelengths while blocking others. Edge filters, in general, have a very steep slope with an average transmission value calculated from the efficiency of transmission and blockage of light in the region of the transition (the boundary between transmission and blocked domains), rather than over the entire spectrum of wavelengths passed or transmitted by the filter.
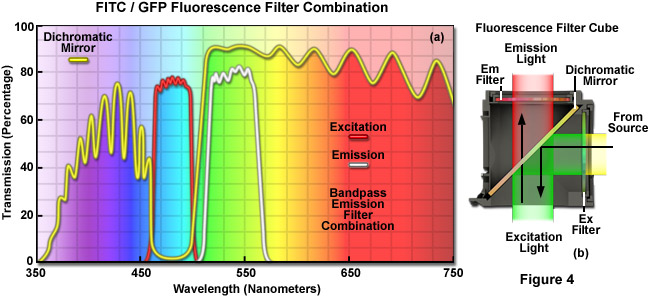
The key to fluorescence microscopy is the use of appropriate filters to segregate the intense excitation light from the much weaker secondary emission generated by fluorophores. The hallmark optical element in fluorescence filtration is the dichromatic mirror, which is designed to be positioned at a 45-degree angle to both the incident illumination arriving from the light source, as well as the optical axis of the microscope, which is co-linear with the objective and specimen. Light from the source (discussed below) passes through the epi-illumination optical train until it reaches the fluorescence filter cube (see Figure 2(b)) where it travels through a defined bandpass excitation filter, and is then reflected down into the objective by the dichromatic mirror to be focused at the specimen plane. This selectively filtered light is used to excite fluorophores whose spectral properties enables them to absorb light within the region allowed by the bandpass of the excitation filter. Fluorescence emission (this light is non-coherent and is emitted over a spherical volume surrounding the fluorophore) is captured by the objective and directed back through the dichromatic mirror, which in turn reflects most of the contaminating excitation light back toward the light source. Emission wavelengths passing through the dichromatic mirror are further purified by another filter of defined bandpass, the emission filter, before traveling to the eyepieces or the camera image plane.
A cut-away diagram of a fluorescence filter cube (or block) along with a drawing of the spectral transmission profiles of the component filters is presented in Figure 4 for a typical filter combination used to separate excitation illumination from fluorescence emission. The excitation filter spectrum (Figure 4(a); red curve) exhibits a high level of transmission (approximately 80 percent) between 460 and 500 nanometers for excitation of fluorophores such as green fluorescent protein or fluorescein. The diagonally-positioned dichromatic mirror (Figure 4(a); yellow curve) reflects wavelengths in the region of the excitation spectrum, while passing higher and lower wavelengths with relatively high efficiency. The pronounced dip in the transmission profile of the dichromatic mirror between 450 and 510 nanometers, which represents a peak in reflectance, serves to direct wavelengths in this spectral region passing from the excitation filter at a 90-degree angle and onto the specimen. The final component in the filter block, an emission or barrier filter (Figure 4(a); white curve), is another bandpass filter that transmits wavelengths in the region between 515 and 565 nanometers, which corresponds to green visible light. Boundaries between transmitted and reflected wavelength bands of the various superimposed spectra are designed to be as steep as possible to assure nearly complete separation of the reflected and transmitted wavelengths. The performance of this filter combination is remarkable and it produces crisp, bright images on a black background.
Because only a narrow bandwidth of light is reflected by the dichromatic mirror, illumination wavelengths shorter than 445 nanometers and longer than 515 nanometers that manage to pass through the excitation filter are also transmitted through the dichromatic mirror. Note that the reflection of excitation light is not 100-percent efficient, and thus, a small amount of blue-cyan light passes through the dichromatic mirror without being reflected. In addition, not all of the light having wavelengths above 510 or below 450 nanometers is transmitted through the mirror. A small percentage of this light is reflected by the mirror through the objective and onto the specimen. Light transmitted from the excitation filter through the dichromatic mirror is partially absorbed by the flat black coating on the interior of the filter block, but some reflects from the surface and passes through the barrier filter at an oblique angle, contributing to background noise.
Fluorescence emission by the specimen (primarily green wavelengths in this case), which results from the blue-cyan light excitation, is gathered by the objective and passes through the dichromatic mirror and barrier filter. The barrier filter is specifically designed to allow only light of wavelengths between 515 and 565 nanometers to reach the microscope eyepieces and/or detector. In serving this duty, the barrier filter effectively prevents excitation light wavelengths reflected by the specimen from reaching the detector. However, a majority of the excitation wavelengths returning from the specimen are reflected towards the excitation filter and illuminator by the dichromatic mirror. The net effect of the filter configuration illustrated in Figure 4(b) is to separate the excitation light, which is substantially higher in intensity, from the much weaker fluorescence emission, as discussed above. The most important point to remember is that the cut-off levels of the filters involved in fluorescence microscopy are not absolute, but enable some light outside the wavelength range to bleed through. Multiband filter combinations contain a specialized version of the dichromatic mirror, termed a polychromatic mirror, which enables the use of multiple bandpass excitation and emission filters in order to simultaneously image two or more fluorescent species.
back to top ^Light Sources for Fluorescence Microscopy
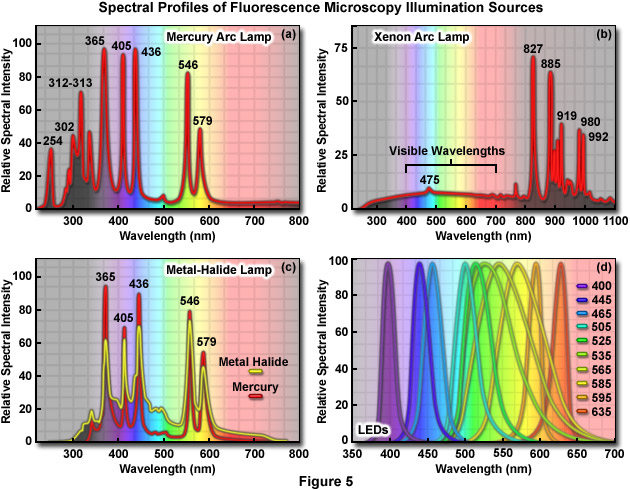
The primary consideration in choosing a light source for fluorescence microscopy is the spectral distribution in relation to the quantum yield and absorption of fluorophores being investigated. In addition, the source must be compatible with the sensitivity of the detector used to capture images, whether it is the human eye, traditional film, a photomultiplier, intensified video tube, or a digital camera system. The choice also depends on the mode of illumination. Widefield fluorescence microscopy requirements are fulfilled with arc-discharge or light-emitting diode (LED) sources, while confocal, total internal reflection, and multiphoton microscopy require the adaptation of various laser systems. When choosing a light source for fluorescence, it is important to remember that most fluorophores are excited by ultraviolet, blue, and green wavelengths. The light output from the most popular sources, arc-discharge lamps (Figure 5(a) through 5(c)), ranges between 10 and 100 times brighter than the 12-volt quartz halogen lamps typically used for transmitted light illumination. The favorite source of illumination for widefield fluorescence microscopy is the mercury arc lamp (Figure 5(a)), which is usually routinely included in base-model microscope configurations. Xenon arc lamps (Figure 5(b)) can be employed when quantitative analysis is critical, and metal-halide (Figure 5(c)) light sources coupled to the microscope via a liquid light guide have become very popular. Any of the three major arc lamp designs are suitable for over 90 percent of fluorescence investigations. LED illumination (Figure 5(d)) sources are also emerging as a viable and stable alternative to arc lamps. Presented in Figure 5 are the spectral output profiles of the most widely used fluorescence light sources.
Proper alignment of arc lamps in fluorescence microscopy is critical in order to achieve Köhler illumination and to avoid bright and dark regions in the fluorescence image. The quality of the lamphouse can often be judged by the stability of correct lamp alignment and by the efficiency of the adjustment knobs for maintaining the alignment. The lamp socket should be equipped with lamp centering screws to permit centering the arc image in the objective rear aperture, and the lamphouse should incorporate an infrared filter to block the very long wavelengths in the far red and infrared that generate a tremendous amount of heat. Several lamphouse designs have a built-in near-infrared suppression filter or contain a slot for such a filter, to eliminate a reddish background seen through the viewfield in some applications. Most importantly, the lamphouse itself should not leak harmful ultraviolet wavelengths and, preferably, should incorporate a switch to automatically shut down the lamp if the housing is inadvertently opened during operation. The lamphouse should also be sturdy enough to withstand a possible burner explosion.
The wide diversity of fluorescence microscopy applications often call for a range of light sources and wavelengths to meet the demands of specific fluorophores and imaging conditions. In some cases, very low irradiation may be required in combination with an ultra-sensitive camera system, whereas for other investigations, strong laser excitation may be necessary in order to kill living cells or selectively bleach a fluorophore. Wavelength requirements often span the entire visible region of the spectrum, as well as portions of the ultraviolet and infrared. Because these multiple illumination requirements cannot be met with a single light source, manufacturers now offer adapters that enable two or more lamps to be simultaneously attached to a single microscope.
back to top ^Fluorescence Microscope Configuration
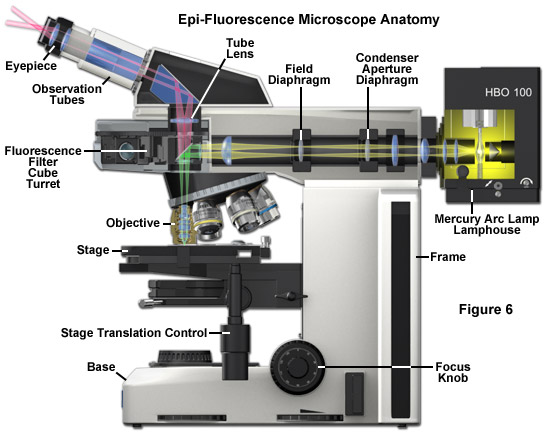
At the heart of the modern fluorescence microscope is the reflected light vertical illuminator, which is sandwiched between the observation viewing tubes and the nosepiece carrying the objectives, as illustrated in Figure 6. The illuminator is designed to direct light generated by a high-intensity source (such as an arc-discharge lamp) onto the specimen by first focusing the light through the microscope objective on the lateral specimen focal plane and then using that same objective to capture the light being emitted by the specimen. This type of illumination strategy has several advantages. The microscope objective, which acts first by serving as a well-corrected condenser, next gathers image-forming fluorescence emission for transmission to the eyepieces or camera detection system. As such, the objective is always in correct alignment. Furthermore, most of the excitation light that is scattered or reflected by the specimen (over a 360-degree angle) travels away from the objective front lens element, rather than being projected directly into the glass, as is the case in transmitted fluorescence illumination. Finally, the specimen area being illuminated is restricted to the same area that is being observed, and both illumination and light collection can utilize the full numerical aperture of the objective.
The primary difference between the epi-fluorescence illuminator and a typical reflected-light illuminator is the omission of the diffusion filter in fluorescence because it would unnecessarily reduce the excitation intensity. In reflected-light microscopy, however, a diffusion filter is required for homogeneous illumination when using a tungsten-halogen light source. Additionally, modern fluorescence microscope illuminators often contain a turret or slider that can hold up to 6 or 8 filter cubes for multicolor imaging. In fluorescence, a red-attenuation filter is often inserted into a slot in the vertical illuminator and is used to eliminate the sometimes disturbing red and near-infrared light portions of the spectrum before they reach the specimen. Multicolor fluorescence is now being increasingly used to examine specimens labeled with two or more fluorophores. This method enables different structures to be highlighted in different colors that can be viewed either together or separately. Multiple colors allow the microscopist to observe interacting species in fluorescence illumination.
back to top ^Keys to Success in Fluorescence Microscopy
By following a limited set of precautions, the novice microscopist can ensure that most fluorescence microscopy investigations can produce successful results. Perhaps the most important aspect in fluorescence is to guarantee that the filter sets transmit the required wavelengths for excitation and emission, and that they simultaneously block the out-of-band light as completely as possible. In practice, this is often quite difficult as the excitation light is usually at least a million times brighter than the emission light. To review, all of the excitation light must be blocked from reaching the eyepieces and the camera detector, while as much of the emission light as possible must be captured and directed to the imaging sensors.
The light source in fluorescence microscopy must be carefully chosen to provide a large amount of excitation energy in the required ranges of the spectrum (typically 10 to 100 nanometers per bandwidth). In many cases, the line-emitting arc discharge lamps can be successfully used, especially when the specimen is labeled with fluorophores that have absorption peaks that correspond to the spectral lines of the light source. For example, Alexa Fluors 405 and 546 are synthetic fluorophores that overlap the 405 and 546-nanometer lines generated by a mercury arc lamp. Using these dyes with a mercury lamp will ensure very bright emission that is relatively easy to visualize and record. A number of fluorophores tuned to specific arc discharge and laser lines are now offered by aftermarket dye manufacturers. When it is necessary to choose a fluorophore that is excited in a low-power continuum region of the mercury or xenon lamp (such as Alexa Fluor 488 or enhanced green fluorescent protein), the microscopist should consider switching to LEDs or metal-halide lamps, which feature higher power output in these regions.
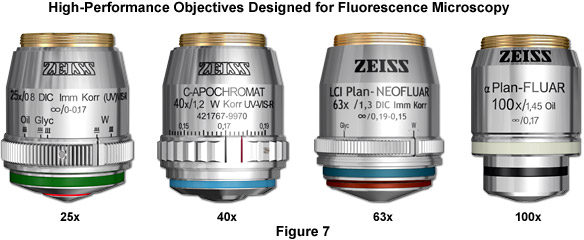
The objectives chosen for fluorescence microscopy are fabricated with numerous lens elements (sometimes up to 16 or more) that can reduce the brightness of fluorescence emission traveling through the objective due to reflections at the glass-air interface within the objective. Nevertheless, there are many objectives available from the manufacturers (see Figure 7) that are specifically designed for use with fluorescence illumination and thus feature high light transmission values in both the ultraviolet and visible portions of the spectrum. In fact, the most modern objectives are fine-tuned to enable parfocal imaging over large wavelength ranges, and these should be considered if financially feasible. When doing live-cell imaging with fluorescence microscopy, water immersion objectives that contain a correction color to compensate for coverslip and temperature variations should be used whenever possible. Fixed and stained specimens, especially those that are well-labeled with bright fluorophores, can be readily imaged with high numerical aperture oil immersion objectives. Always remember to check objectives and immersion fluids for autofluorescence (by examining a mounted coverslip without a specimen embedded), which will obscure specimen detail and lead to higher background.
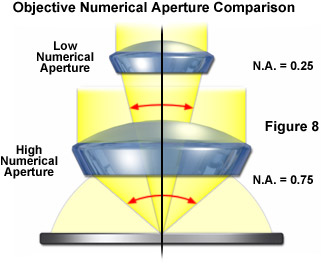
One of the most important points to consider when conducting fluorescence microscopy investigations is the very low level of fluorescence emission that is generated by the specimen, as discussed repeatedly above. The objective is charged with gathering as much of this emission as possible so the best results are obtained with the largest numerical aperture objectives. To review, the amount of emission light reaching the detector will be low with objectives having a numerical aperture less than 0.5, whereas if the objective numerical aperture is doubled in size, approximately 16 times the fluorescence emission can be gathered. Immersion media, particularly oil, help to eliminate the loss of light produced by the reflection of light from glass surfaces, thus rendering even brighter images. A comparison of microscope objective numerical aperture light cones is presented in Figure 8 to demonstrate the vast differences in the amount of light collected.
Among the most practical hints on conducting successful fluorescence microscopy include making sure that imaging is done in a setting with reduced room lighting (usually with the lights turned off). It is often handy to keep a flashlight close to the microscope to ease recording data, taking notes, or configuring the microscope in a darkened room. When the room lights are left on, a significant amount of overhead light can enter the objective and generate noise in the images. In addition, when the specimen is not being viewed or imaged, the excitation light should be blocked with a shutter or filter to avoid unnecessary photobleaching by the illumination system. If immersion medium is autofluorescent, the background becomes noticeably brighter and image contrast is reduced. Always check the status of new immersion oils before they are used to image specimens. Another important point is to never remove the integral heat-protection filter, because fluorescence filters are sensitive to the heat and bright light emitted by the illuminator. The illuminator should also be examined on a routine basis and readjusted if necessary. This is especially critical when a new lamp is installed. The final point to consider involves specimen preparation. Always thoroughly wash specimens (tissues and cells) after staining to remove residual fluorophores that will only serve to increase background noise.
When paired with the optical microscope, fluorescence enables investigators to study a wide spectrum of phenomena in cellular biology. Foremost is the analysis of intracellular distribution of specific macromolecules in sub-cellular assemblies, such as the nucleus, membranes, cytoskeletal filaments, mitochondria, Golgi apparatus, and endoplasmic reticulum. In addition to steady state observations of cellular anatomy, fluorescence is also useful to probe intracellular dynamics and the interactions between various macromolecules (including diffusion, binding constants, enzymatic reaction rates, and a variety of reaction mechanisms) in time-resolved measurements. Likewise, important cellular functions such as endocytosis, exocytosis, signal transduction, and transmembrane potential generation have come under examination with fluorescence microscopy. Because of the tremendously sensitive emission profiles, spatial resolution, and high specificity of fluorescence investigations, the technique is rapidly becoming an important tool in genetics and cell biology, and is at the forefront of biomedical research.
Contributing Authors
Rudi Rottenfusser - Zeiss Microscopy Consultant, 46 Landfall, Falmouth, Massachusetts, 02540.
Erin E. Wilson and Michael W. Davidson - National High Magnetic Field Laboratory, 1800 East Paul Dirac Dr., The Florida State University, Tallahassee, Florida, 32310.